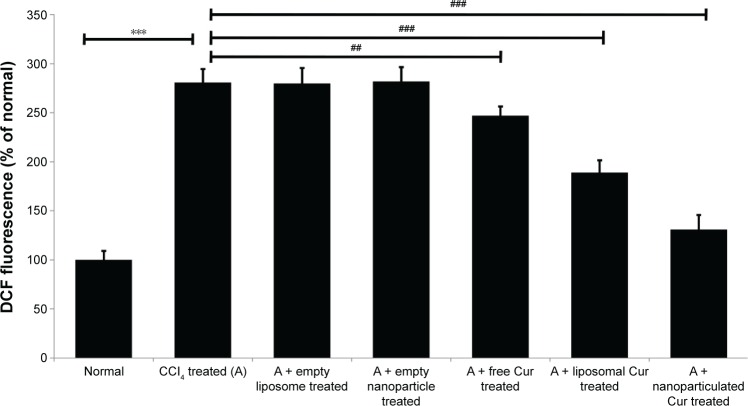
Figure 5.
Values of ROS in liver mitochondria of rats.
Note: CCl4-treated controls were compared with normal animals (***P<0.0001) and other experimental groups showed significant difference (###P<0.0001 and ##P<0.001) from the CCl4-treated control group (A).
Abbreviation: ROS, reactive oxygen species.

