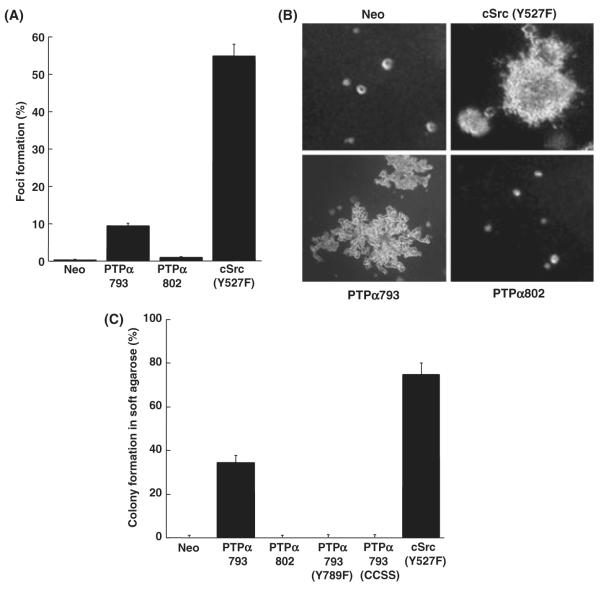
Figure 4.
Focus formation and colony formation by PTPα overexpressor cells. (A) Neo (negative control), PTPα793 and PTPα802 NIH3T3-derived overexpressor cells and cSrc(Y527F) overexpressor cells (positive control) were separately (500 cells each) mixed with 2 × 10⁵ NIH3T3 cells and cultured in monolayer without doxycycline for 14 days. The percentages of cells forming foci and standard errors of the mean are shown [two independent experiments each, except six for PTPα802]. [The focus-forming activities of PTPα793 and PTPα802 were statistically different (two-sided t-test) at α = 10−4.] (B) The same cell lines [plus PTPα793(Y789F) and PTPα793(CCSS), not shown] were cultured in 0.3% agarose without doxycycline, and colonies were photographed after 16–18 days. (C) Percentages of cells forming colonies in soft agarose with standard errors of the mean (two independent experiments each, except six for PTPα802). (The colony-forming activities of PTPα793 and PTPα802 were statistically different at α = 10−8).

