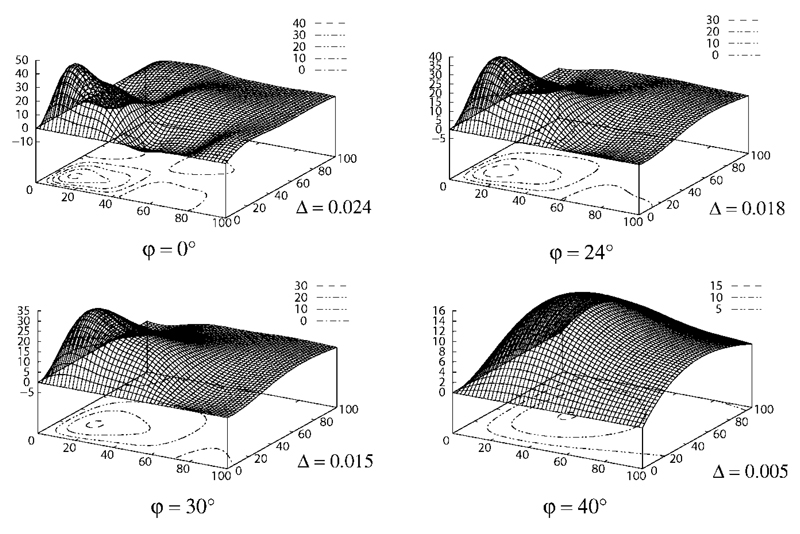
Fig. 3.
Simulation of the lactate methyl signal S(τ1, τ2, φ) acquired with the DQF sequence (see Fig. 2) as given in Eq. [1] against τ1, τ2 with the muscle fiber orientation φ relative to B0 as parameter. Note that the peak signal amplitude decreases and the peak moves towards longer echo times (τ1, τ2) as the angle φ between muscle fiber orientation and the orientation of the main magnetic field B0 increases. Contours are plotted for signal levels (a.u.) in steps of 10. Also note the different scale of each graph. For more details see text.

