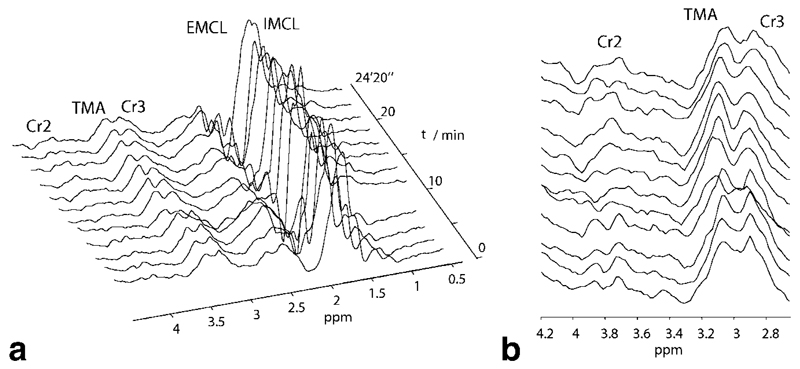
Fig. 6.
1H STEAM spectra acquired during plantar flexion exercise in an interleaved experiment. (a) Full spectral range of metabolites. Note that the EMCL/IMCLs at 1.3 ppm are not increased during exercise, e.g., because of motion, and thus the peak observed in DQF spectra is unlikely to be due to lipid contamination. (b) Zoomed-in spectral region showing creatine CH2 and CH3 resonances and TMA. (31P spectra and DQF lactate spectra of the same experiment shown in Fig. 5).

