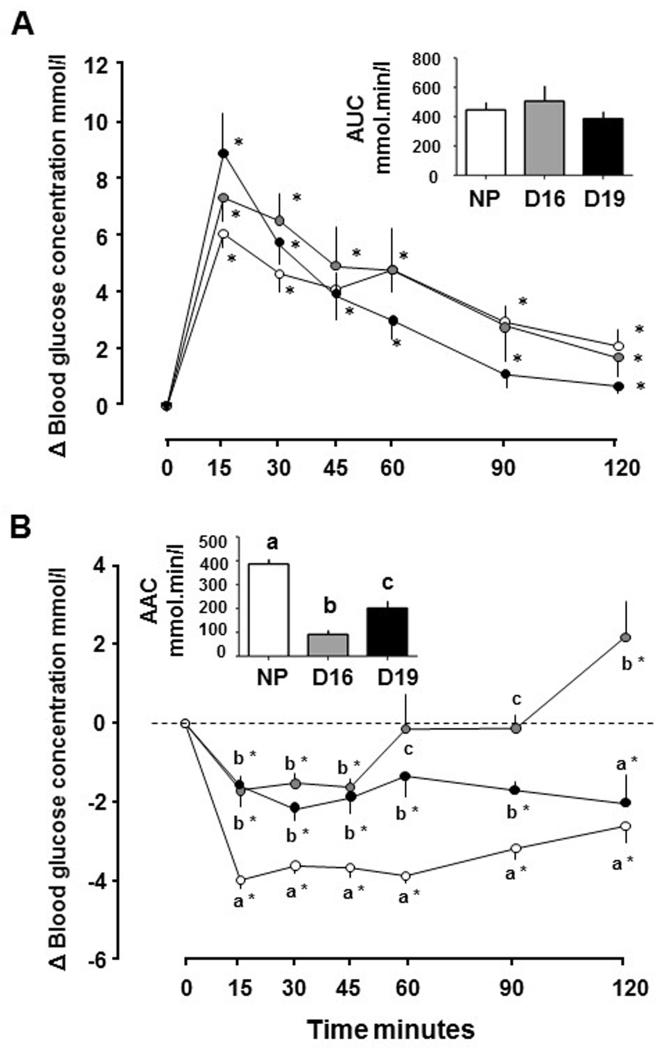
Figure 1.
Mean ± SEM changes in blood glucose concentrations from basal pre-treatment values with time after intraperitoneal administration of (A) glucose (1 g/kg) and (B) insulin (0.25 U/kg) in non-pregnant (NP) females (n=8-11, open symbols) and pregnant dams at day (D)16 (n=6-9, grey symbols) and D19 (n=6-8, black symbols). Inserts show area (a) under the glucose curve (AUC) and (b) above the glucose curve (AAC). In (a) and (b), *significant increment above baseline values in each group (p<0.05, paired t-test). In (b) values at each sampling time with different letters indicate significant differences between groups (p<0.05, one way ANOVA).

