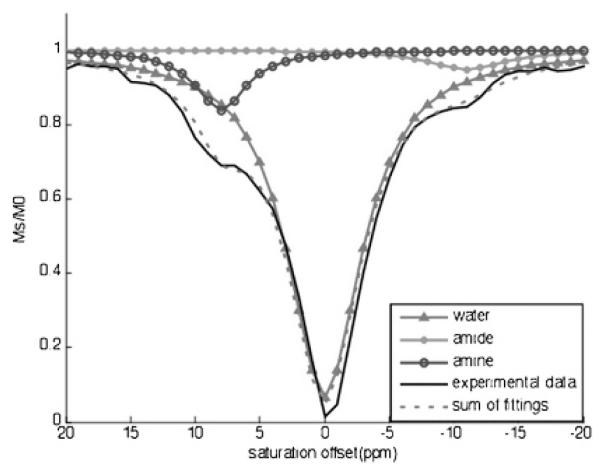
Figure 2.
The extraction of PARACEST effects of the amine and amide from experimental data by three lorentzian line shapes centered at 0, −11, and +8 ppm. The CEST spectrum (solid line, no symbol) of Yb-DO3A-oAA at pH 6.5 and 37°C was acquired with selective saturation applied at 12.2 μT for 6 s, from +20 ppm to −20 ppm in 1 ppm increments. The line-fitting output showed a lorentzian line shape of water that was symmetric about 0 ppm (solid line with triangles) and lorentzian line shapes of the CEST effects of the amine (solid line with open circles) and the amide (solid line with filled circles).

