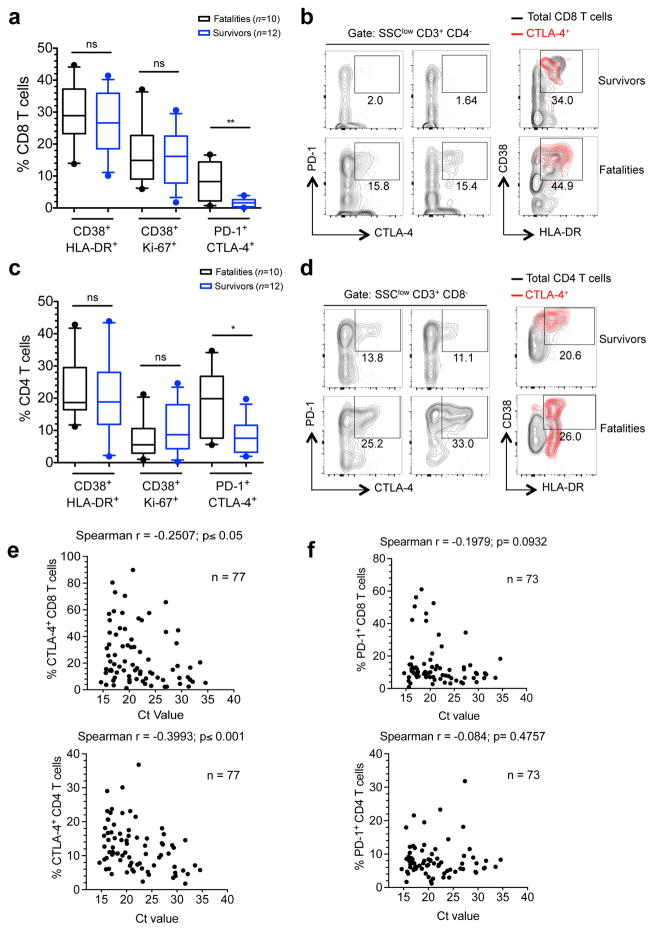
Figure 2. Functional properties of T cells in EVD patients.
a, Frequencies of CD8 T cells co-expressing the indicated markers. b, Plots of two surviving and two fatal EVD patients depicting CD8 T cell populations co-expressing the indicated markers. Overlays indicate activation status of CTLA-4+ CD8 T cells (red). Total CD8 T cells are represented by black contours. c, CD4 T cells co-expressing the indicated markers. d, Plots of two surviving and two fatal patients depicting CD4 T cell populations co-expressing the indicated markers. Overlays indicate activation status of CTLA-4+ CD4 T cells (red). Total CD4 T cells are represented by black contours. e, Correlation between frequency of CD8 T cells (upper graph) and CD4 T cells (lower graph) expressing CTLA-4 and Ct values. f, Correlation between the frequency of CD8 T cells (upper graph) and CD4 T cells (lower graph) positive for PD-1 and Ct values. Statistics was performed by Mann-Whitney test. ns, not significant; * p≤0.05; ** p≤0.01.

