
FIGURE 1:
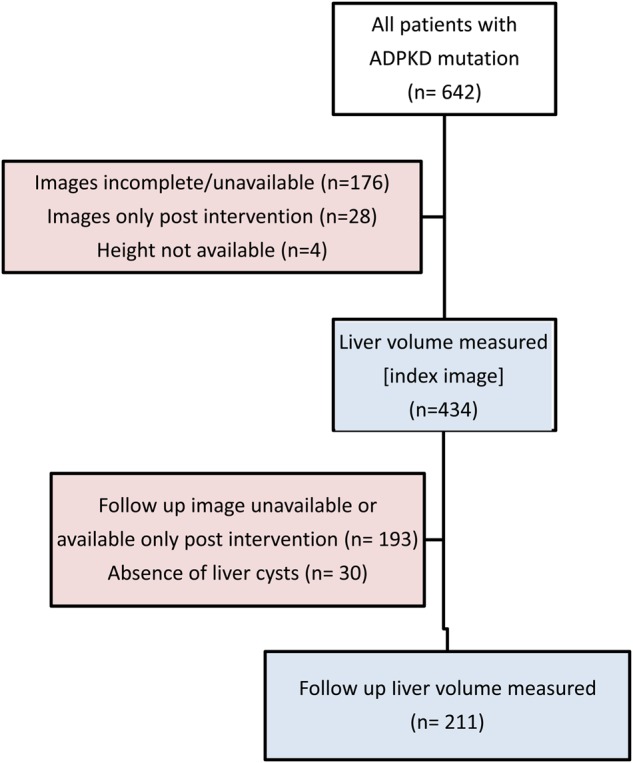
Study flow chart. The chart shows the number of patients with PKD mutations, the number of patients with available liver imaging and the number of patients with sequential liver images available for liver growth calculation.
Official websites use .gov
A
.gov website belongs to an official
government organization in the United States.
Secure .gov websites use HTTPS
A lock (
) or https:// means you've safely
connected to the .gov website. Share sensitive
information only on official, secure websites.
Study flow chart. The chart shows the number of patients with PKD mutations, the number of patients with available liver imaging and the number of patients with sequential liver images available for liver growth calculation.