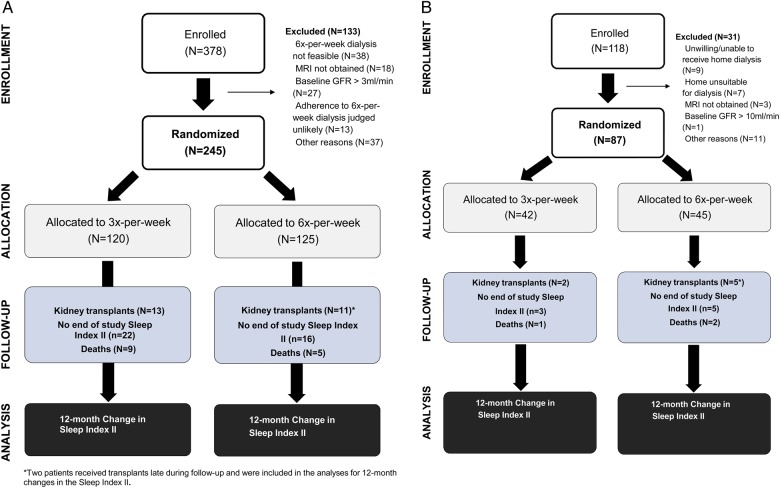
FIGURE 1:
(A) Flow diagram for the Daily Trial showing the number of subjects enrolled and assigned to each study arm (intervention/control) and the number of subjects analyzed with baseline and 12-month ascertainment of each mental health and depression, including reasons for dropout. (B) Flow diagram for the Nocturnal Trial showing the number of subjects enrolled and assigned to each study arm (intervention/control) and the number of subjects analyzed with baseline and 12-month ascertainment of mental health and depression, including reasons for dropout.

