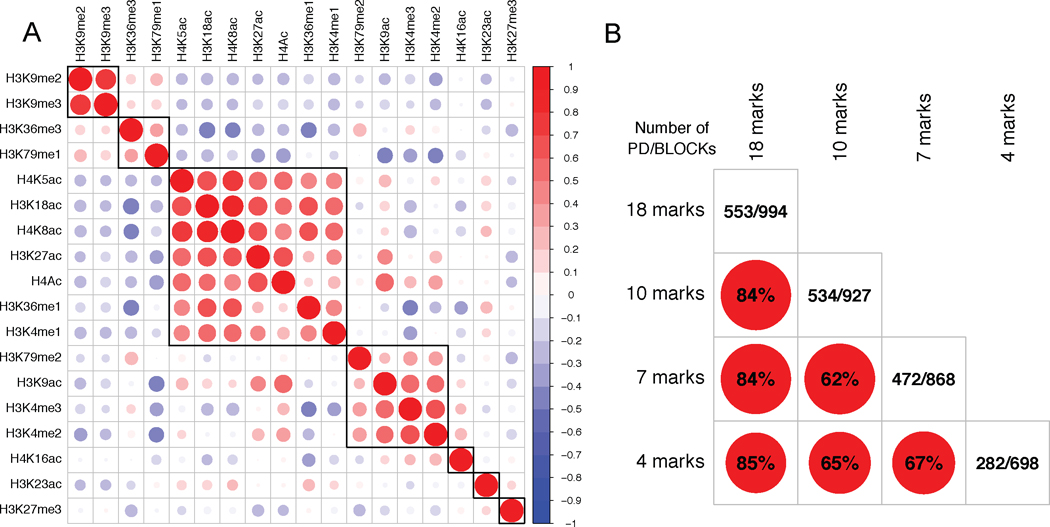
Fig 6.
A. Genome-wide correlation plot for 18 histone marks in S2 cells. The marks are ordered based on the result of hierarchical clustering. B. Comparison of models with different input histone marks. Each of the off-diagonal element is the percentage of boundaries (within 20kb) shared by any pair of the models. The diagonal element is the number of boundaries shared with physical boundaries in Sexton et al. (2012) (short as PD) / the number of segments detected for each model.

