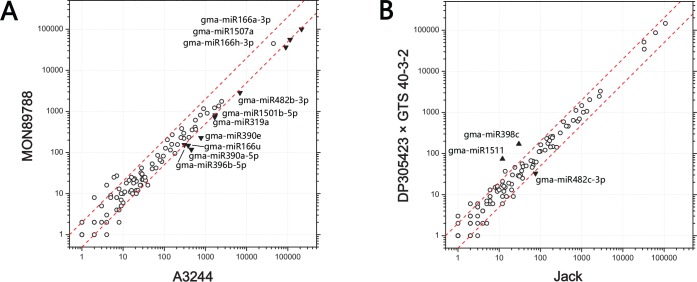
Fig 2. Scatter plot demonstrating the differential expression of gma-miRNAs in GM soybean seeds.
The normalized values were calculated using the following formula: (miRNA reads count/total clean reads) × 107. Red dotted lines indicate the value of |log2| = 1. Down- or up-regulated gma-miRNAs are indicated with black triangles; these gma-miRNAs meet the following three conditions: raw reads of gma-miRNAs > 100, |log2 ratio| > 1, and P < 0.001. A: Results of the comparison between MON89788 and A3244. B: Results of the comparison between DP-3Ø5423×GTS 40-3-2 and Jack.

