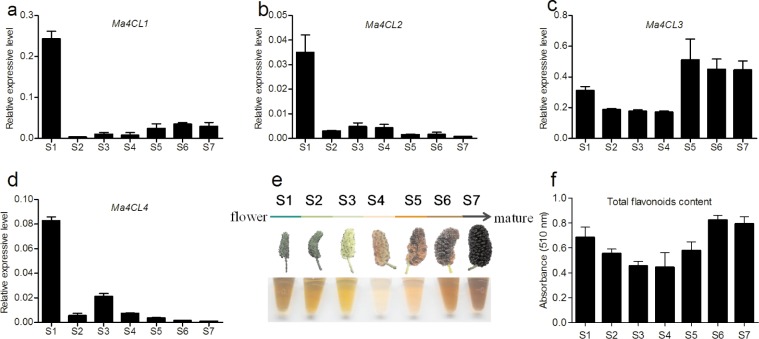
Fig 7. Expression of Ma4CL genes and total flavonoid contents during mulberry fruit development.
a, b, c, and d represent Ma4CL1, Ma4CL2, Ma4CL3, and Ma4CL4 expression levels, respectively, e and f indicate total flavonoid contents during fruit development from stage S1 to S7. Error bars on each column indicate SDs from three replicates.

