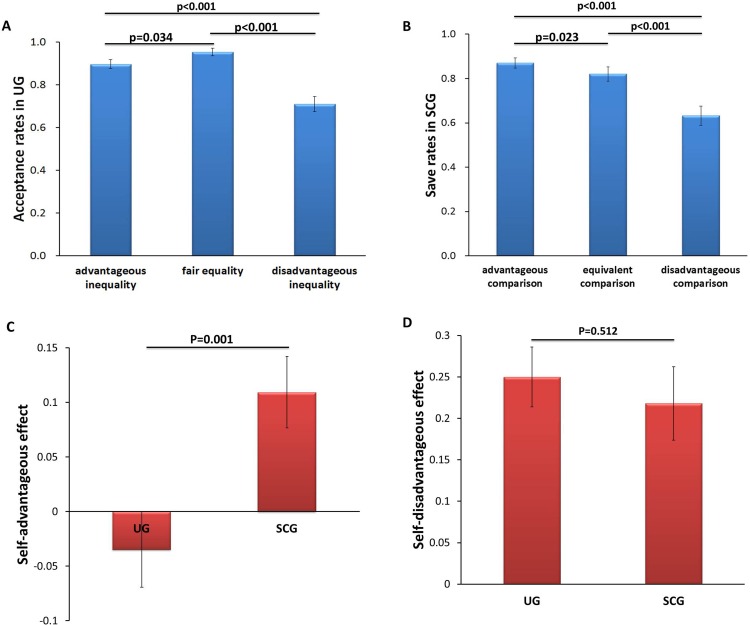
Fig 2. Behavioral results in Study 1.
(A). Mean acceptance rates as a function of three fairness levels in the ultimatum game. (B). Mean save rates as a function of three comparison levels in the social comparison game. (C). Mean effect values as a function of self-advantageous effect (i.e., self-advantageous effect on acceptance rates in UG = (AI-FE) / FE and self-advantageous effect on save rates in SCG = (AC-EC) / EC) for ultimatum game and social comparison game. (D). Mean effect values as a function of self-disadvantageous effect (i.e., self-disadvantageous effect on acceptance rates in UG = (FE-DI) / FE and self-disadvantageous effect on save rates in SCG = (EC-DC) / EC) for ultimatum game and social comparison game. Error bars represented standard errors.

