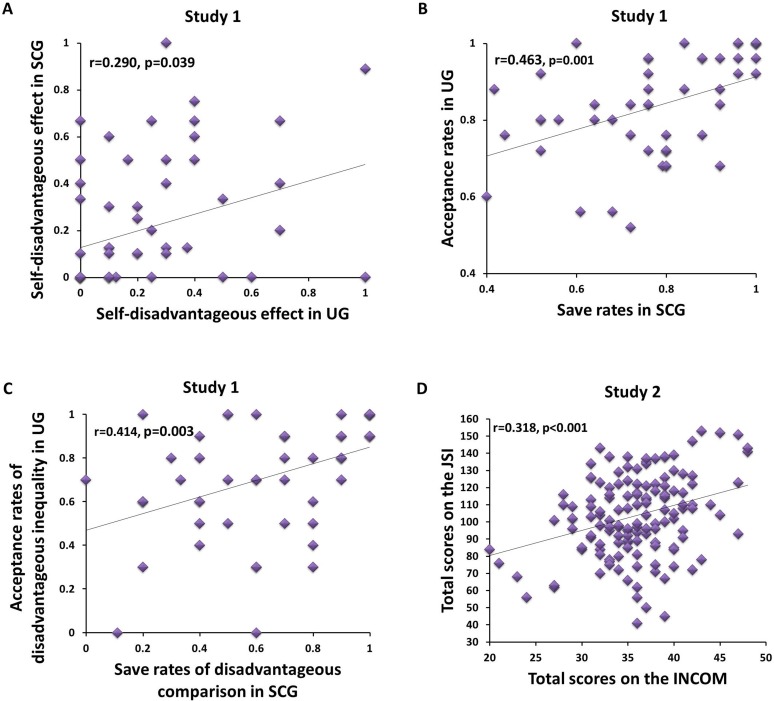
Fig 3. Scatter plots of the association between two experiments and between two self-reported inventories.
(A). Study 1: The self-disadvantageous effect in ultimatum game had a significantly positive correlation with the self-disadvantageous effect in social comparison game. (B). Study 1: The acceptance rates in ultimatum game had a significantly positive correlation with the save rates in social comparison game. (C). Study 1: The acceptance rates in disadvantageous inequality condition in ultimatum game had a significantly positive correlation with the save rates in disadvantageous comparison condition in social comparison game. (D). Study 2: The total scores on the Iowa-Netherlands Comparison Orientation Measure had a significant positive correlation with the total scores on the Justice Sensitivity Inventory. The solid line was the regression line through the data in each plot.

