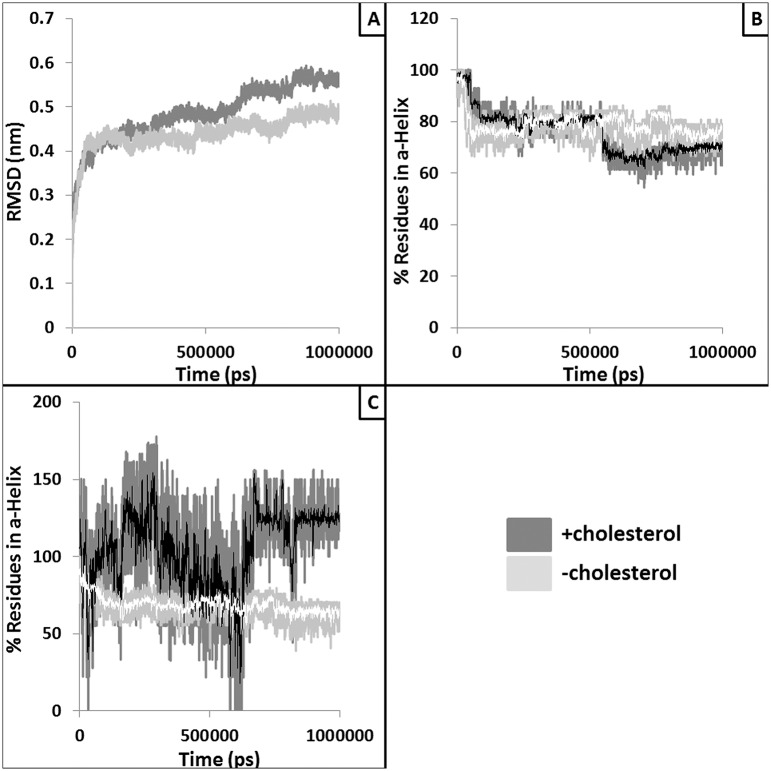
Fig 3. Alteration in overall structure and the helicity of the peptide binding domain (PBD).
Panel A provides RMSD trajectories of the PBD extracted from the simulations with (dark grey) and without (light grey) the docked cholesterol. Panel B and C provide the plots where percentages of residues in α-helix conformation are plotted against the simulation time for chain A PBD helix (residues: 50–80) and Chain B PBD helix (residues: 52–89), respectively. White and black lines represent moving averages (period: 10) of the raw data.

