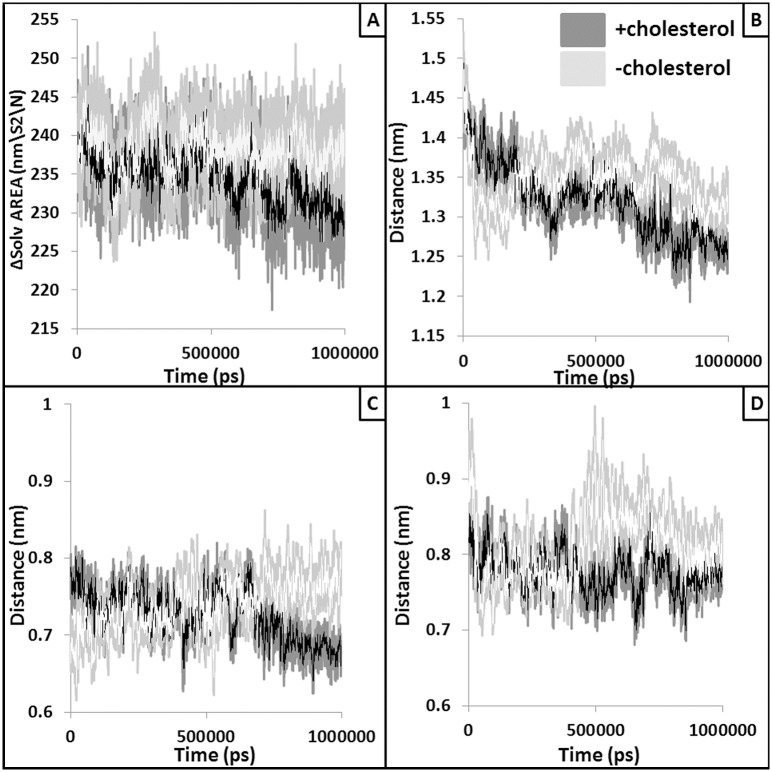
Fig 4. Alteration in the volume and size of the peptide binding pocket.
Solvent accessible surface area (SASA) values of the peptide binding region are plotted against the simulation time (panel A). Light grey line represents for without cholesterol runs whereas dark grey line represents SASA values extracted from simulation performed with the docked cholesterol. White and black lines show running average of 10 points. Panel B plots the distance (nm) between two helices of PBD whereas panel C and D shows the average distance between the peptide and the chain A PBD helix and chain B PBD helix, respectively. White and black lines represent moving averages (period: 10) of the raw data.

