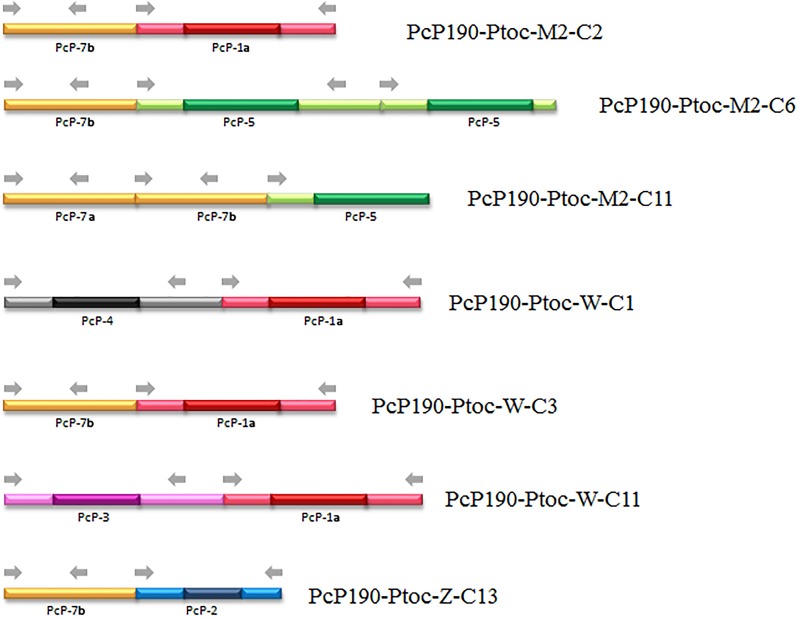
Fig 7. Scheme of the fragments obtained from male genomic DNA and microdissected Z and W chromosomes composed of different juxtaposed types of sequences of PcP190 sat DNA.
Gray arrows indicate the annealing sites of the primers P190F and P190R used to obtain the sequences. The different colors represent different sequence types. Darker colors distinguish the hypervariable regions from the more conserved regions (light green, light gray, light red and light purple).

