
FIG. 5.
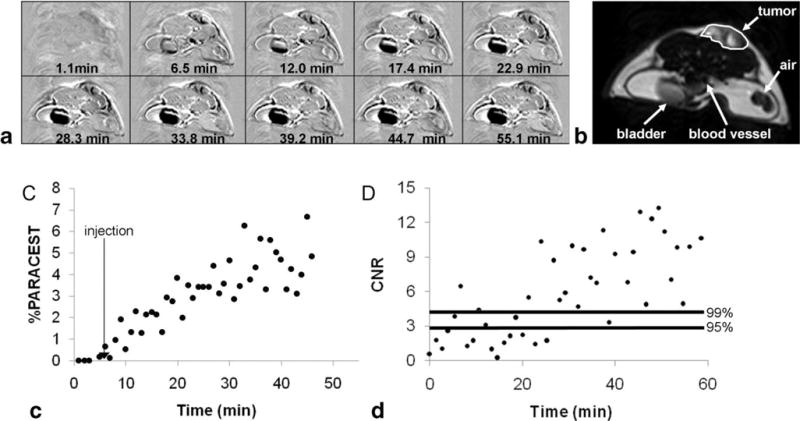
The in vivo DCE MRI study of tumor tissue with a presat-RARE MRI method with a RARE factor of 16 (80 s/image). The contrast agent was Tm(1). A: The parametric maps represent the difference between postinjection images and the average of the preinjection images at different time points. B: A representative image with marked tumor ROI area for quantitative analysis. C: The dynamic change in PARCEST contrast of tumor ROI. D: The corresponding CNR of the PARACEST contrast for the same ROI. Horizontal lines represent the 95% and 99% probability levels that the CNR was generated from the PARACEST agent.