Figs 6 and 7 are duplicates of Fig 5. Please view the correct Figs 6 and 7 below.
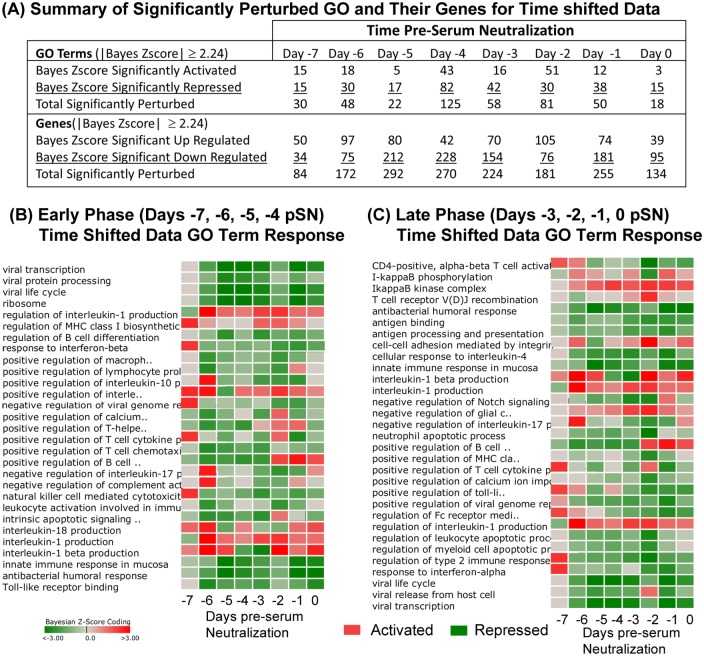
Fig 6. DBGGA GO term analysis on time-shifted data.
(A) Summary table of GO Terms and component gene perturbation by time pre-seroconversion. Only GO terms and their genes with Bayesian score ≥|2.24| are included in analysis. (B-C) Heat maps of perturbed GO terms described by time pre-seroconversion and identified from the Early Phase (time –6, –5, –4, –3 pSN) (B) and the Later Phase (time –2, –1, 0, 1 pSN) (C). Red color indicates activation, green color indicates repression. Intensity of color represents amplitude of perturbation. The list of GO terms shown represent a subset of all perturbed terms that were selected as being most relevant to innate and adaptive immune response.
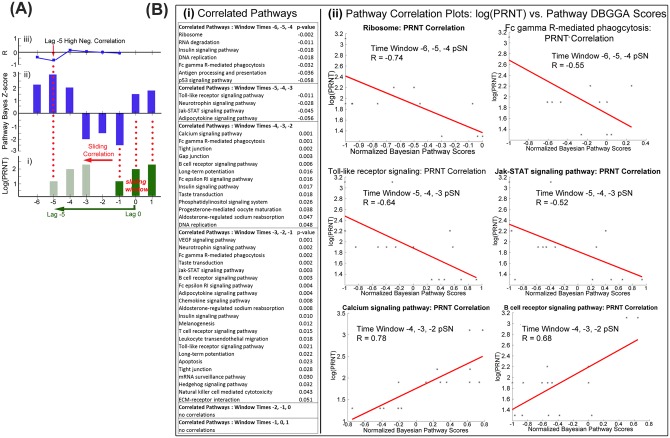
Fig 7. Sliding window correlation (SWC) to identify pathways associated with serum neutralization titers.
(A) Visualization of sliding window correlation approach. (i) Hypothetical Log10(PRNT80) data taken from time points capturing neutralizing antibody levels during time period in which animals reached threshold for protection (log10 = 1.903) (dark green bars). (i-ii)The trajectory of the Log10(PRNT80) data is applied to other time points prior to serum neutralization (light green bars) to identify pathway with complementary or antithetical trajectories (A-ii for hypothetical Pathway Bayesian Z-score data, dark blue bars). (iii) Graphical representation of the R correlation coefficient value between Log10(PRNT80) and Pathway Bayesian Z-score. (B) Pathways correlated to PRNT80values at the time of seroconversion listed by pathway at incremented window times (each consisting of three time points), with significant correlation p-values (i), or plotted as log(PRNT80) vs normalized Bayesian Z-score (ii) for six selected pathways having highest correlations.
Reference
- 1.Laughlin RC, Drake KL, Morrill JC, Adams LG (2016) Correlative Gene Expression to Protective Seroconversion in Rift Valley Fever Vaccinates. PLoS ONE 11(1): e0147027 doi: 10.1371/journal.pone.0147027 [DOI] [PMC free article] [PubMed] [Google Scholar]


