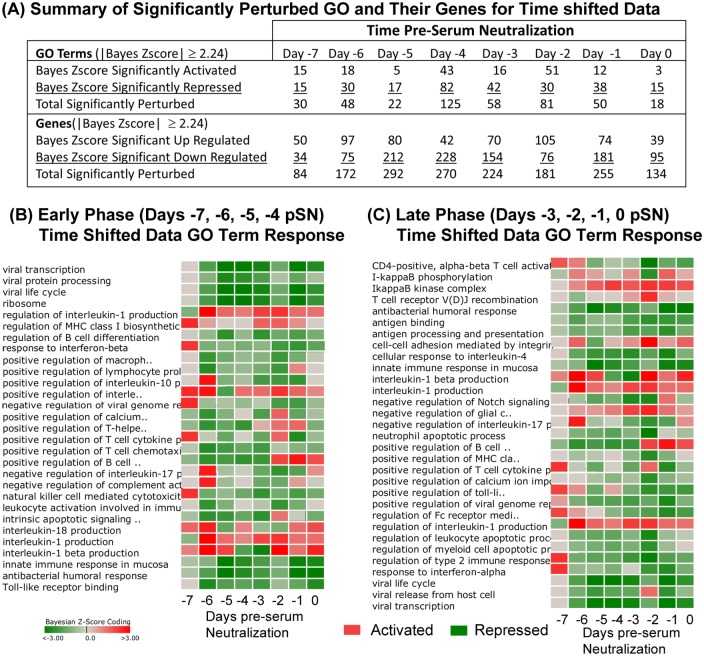
Fig 6. DBGGA GO term analysis on time-shifted data.
(A) Summary table of GO Terms and component gene perturbation by time pre-seroconversion. Only GO terms and their genes with Bayesian score ≥|2.24| are included in analysis. (B-C) Heat maps of perturbed GO terms described by time pre-seroconversion and identified from the Early Phase (time –6, –5, –4, –3 pSN) (B) and the Later Phase (time –2, –1, 0, 1 pSN) (C). Red color indicates activation, green color indicates repression. Intensity of color represents amplitude of perturbation. The list of GO terms shown represent a subset of all perturbed terms that were selected as being most relevant to innate and adaptive immune response.

