Table 1.
SAR of initial analogs.
| # | Structure | R c | AMP IC50 µM | Ca2+ IC50 µM | ERK IC50 µM |
|---|---|---|---|---|---|
| 11a | 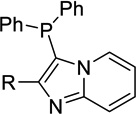 |
H | Inact | 35a | <50%b |
| 12a | 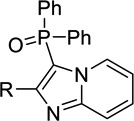 |
H | Inact | Inact | <50%b |
| 12c | Me | Inact | 27 ± 13a | <50%b | |
| 12b | 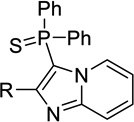 |
H | 63 ± 0a | 4.03 ± 0.07 | <50%b |
| 12d | Me | 18 ± 3 | 1.0 ± 0.16 | 0.0091, 0.030c | |
| 13a | 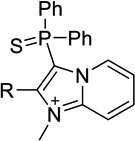 |
H | 39 ± 0a | 2.5 ± 0.4 | <50%b |
| 7 | Me | 1.7 ± 0.1 | 0.051 ± 0.008 | 0.030 ± 0.006 | |
| 15a | 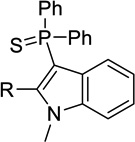 |
H | Inact | 7.3± 2.3 | <50%b |
| 15b | Me | Inact | 2.8 ± 0.0 | <50%b | |
| 18a | 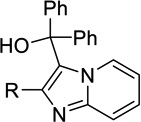 |
H | Inact | Inact | <50%b |
| 18b | Me | Inact | Inact | <50%b | |
| 19a | 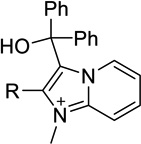 |
H | Inact | Inact | <50%b |
| 19b | Me | Inact | Inact | <50%b |
The cAMP and Ca2+ assay activity is the mean IC50 with SD from two separate experiments, each ran in duplicate. The ERK assay activity is the mean IC50 with SD from one experiment run in duplicate.
These compounds showed partial efficacy in their antagonistic behavior.
These compounds showed <50% inhibition at the highest concentration (50 µM) tested.
Both IC50 values are reported here as we feel that the standard deviation between the replicates is significant. (Inact=Inactive)
