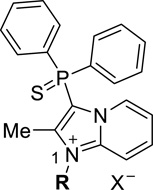
Table 2.
SAR of analogs in position one.
 | ||||
|---|---|---|---|---|
| R | # | cAMP IC50 µM | Ca2+ IC50 µM | ERK IC50 µM |
| 7 | 1.7 ± 0.1 | 0.051 ± 0.008 | 0.030 ± 0.006 | |
| 20a | 1.3 ± 0.0 | 0.032 ± 0.005 | 0.016 ± 0.001 | |
 |
20b | 2.1 ± 0.2 | 0.073 ± 0.023 | 0.016, 0.063b |
 |
20c | 2.1 ± 0.0 | 0.080 ± 0.013 | 0.013, 0.028b |
| 20d | 0.11 ± 0.01 | 0.0016, <0.0005a | 0.0035, <0.0005a | |
 |
20e | 0.045 ± 0.000 | 0.00096 ± 0.00023 | 0.0013 ± 0.0007 |
 |
20f | 0.94 ± 0.08 | 0.0011, < 0.0005a | 0.015 ± 0.000 |
| 20g | 0.71 ± 0.00 | 0.013 ± 0.002 | 0.0062 ± 0.0007 | |
The cAMP and Ca2+ assay activity is the mean IC50 with SD from two separate experiments, each ran in duplicate. The ERK assay is the mean IC50 with SD from one experiment run in duplicate.
The two replicate IC50s are reported here, one (<0.5 nM) being less than that could be detemined accurately by the assay.
Both IC50 values are reported here as we feel that the standard deviation between the replicates is significant.
