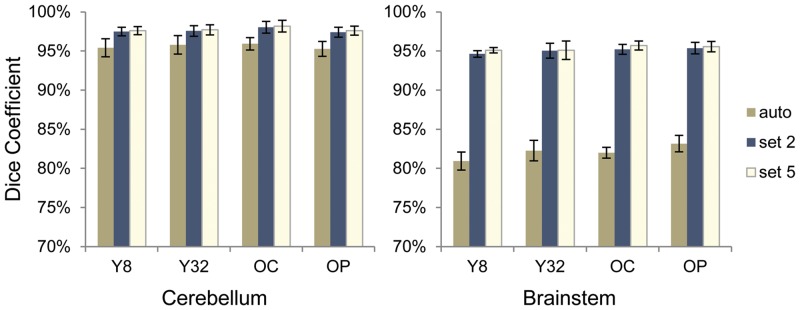
Fig 3. Dice coefficient for cerebellar and brainstem segmentations of the test scans against manual correction.
The data shown in the graphs are from FreeSurfer automated process (auto), corrective learning using a training set of 2 scans (set 2) and corrective learning using a training set of 5 scans (set 5). There are four groups of participants: Y8, the younger healthy control group scanned using an 8 channel head coil; Y32, the younger healthy control group scanned using a 32 channel head coil; OC, the older healthy control group scanned using a 32 channel head coil; and OP, the older patient group with neurodegeneration scanned using a 32 channel head coil. Error bars indicate ±1 standard deviation.

