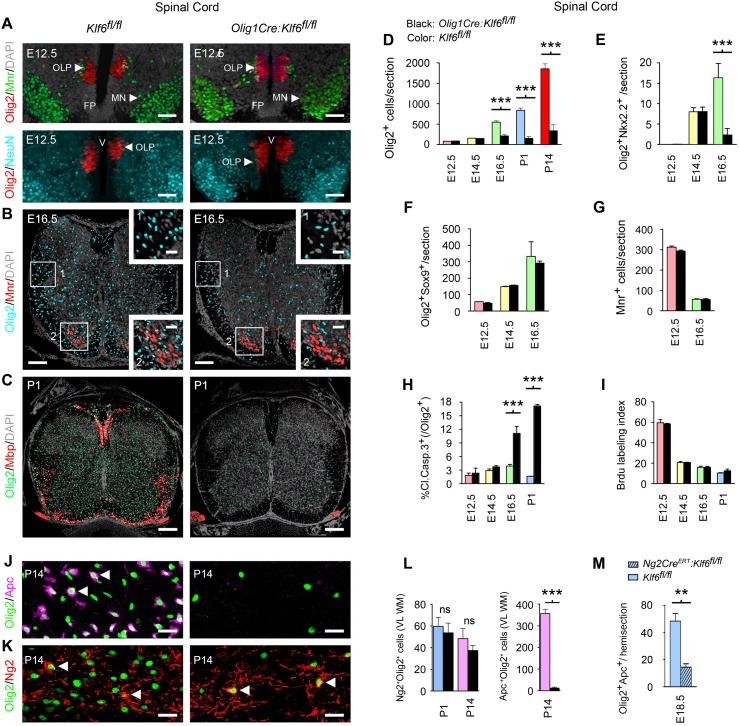
Fig 2. Conditional Klf6 inactivation in vivo causes selective loss of differentiating oligodendrocytes.
(A–F) Confocal and morphometric analysis of oligodendrocyte numbers in developing Olig1Cre:Klf6fl/fl and control Klf6fl/fl spinal cords. Panel (A) shows samples from E12.5, immunostained for Olig2 and either Mnr (upper panels) or NeuN (lower panels). At E12.5, Olig2+ numbers in Olig1Cre:Klf6fl/fl and control samples are identical, and no differences are seen in neuronal markers. In controls, Olig2+ cell numbers then increase from E16.5 through P14, but no increase is seen in Olig1Cre:Klf6fl/fl samples (B–D). Areas outlined in panel (B) are shown at higher magnification, inset. See also S4B Fig. At P1, myelin proteins are expressed in controls, but not in Olig1Cre:Klf6fl/fl spinal cords (C). (E,F) Analysis of stage-specific markers. Early events in differentiation, such as Nkx2.2 co-expression at E14.5, occur normally in Olig1Cre:Klf6fl/fl mice, but differentiating cells are selectively lost at subsequent timepoints (E). In contrast, numbers of Olig2+Sox9+ OLP remain identical to controls (F). There are no changes in Mnr+ motor neurons, which share the same origin as ventral OLP in the pMN domain (A upper panels, B, G). (H,I) Selective loss of differentiating cells is associated with increased apoptosis (H), but OLP proliferation is unaffected (I). (J–L) Postnatal stage-specific analysis confirms absence of differentiating (Apc+) oligodendrocytes from Olig1Cre:Klf6fl/fl mice (J,L), whereas OLP (Olig2+Ng2+) numbers are comparable to controls (K,L). Representative cells are arrowed. (M) Analysis of NG2creER–:Klf6fl/fl mice, in which Klf6 inactivation is inducibly targeted to OLP. See also S4C and S4D Fig. Similar to Olig1Cre:Klf6fl/fl embryos, these mice also display selective loss of differentiating oligodendrocytes. Data are mean ± SEM. Statistics, (D–I,L) ANOVA plus Bonferroni post test, (M) Student’s t test, ***p < 0.001. Scale: (A,B) 100 μm, inset 20 μm, (C) 250 μm, (J,K) 10 μm. Data shown are from lumbar sections of two to six mice per genotype per timepoint. Thoracic sections showed compatible findings. Individual values are in S1 Data.

