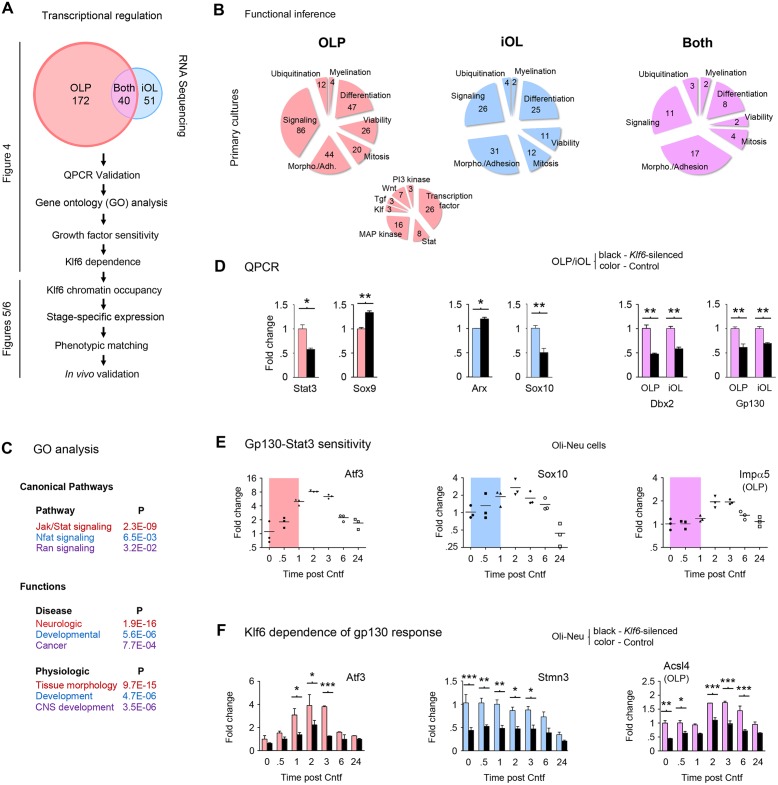
Fig 4. RNA sequencing identifies Klf6-dependence of gp130-driven transcriptional patterns.
(A) Overview of approach used to define key Klf6 effectors. Initial RNA-seq analysis of primary mouse cultures identifies 212 unique Klf6-regulated transcripts in OLP and 91 in iOL, of which 40 are shared. See S1–S3 Tables and S5A and S5B Fig. (B,C) Results of functional inference (B) and GO analysis (C) of RNA-seq data, from primary OLP (red), iOL (blue), or both (purple). In (B), numbers of Klf6-regulated genes are indicated for each function. Implicated signaling pathways in OLP are presented as a smaller Venn diagram, inset. (D) Examples of qPCR validation of RNA-seq data for select OLP, iOL, and shared genes. A larger cohort of validation data is presented in S5C Fig. (E) Gp130 sensitivity of select validated differentially expressed transcripts. Results are shown from Oli-neu cells treated with Cntf (100 ng/ml) for up to 24 h. Colored areas indicate the time period before peak response of Klf6 to Cntf. See also S5D Fig. (F) Klf6-dependence of Cntf-induced responses. qPCR analysis of Klf6-silenced and control Oli-neu cells treated with Cntf for up to 24 h. Cntf sensitivity of differentially expressed targets is blunted in Klf6-silenced samples. Note also that some genes are Cntf-independent but Klf6-dependent during differentiation. Data are mean ± SEM. Statistics, (D) Student’s t test, (F) Two-way ANOVA plus Bonferroni post-test, *p < 0.05, **p < 0.01, ***p < 0.001. Data are representative of two to three independent studies. RNA-seq data are presented in full in S1–S3 Tables and are available on the GEO website (http://www.ncbi.nlm.nih.gov/geo/) (Accession number GSE79245). Individual values for all other quantifications are in S1 Data.

