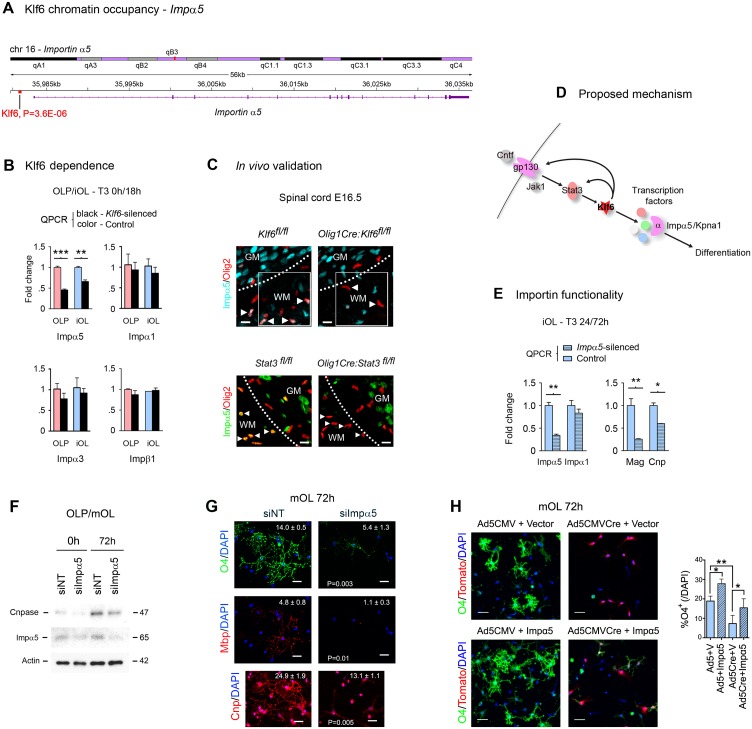
Fig 6. Klf6 promotes differentiation via transactivation of importin-α5.
(A–C) ChIP-seq (A), qPCR (B), and confocal imaging data (C) identifying Klf6 regulation of the downstream importin effector Impα5. Data are also compatible with RNA-seq results in S1–S3 Tables. (A) ChIP-seq in primary mouse OLP and iOL demonstrates direct Klf6 binding to the promoter region of Impα5, which RNA-seq also identifies as Klf6-regulated (see S3 Table). (B) QPCR for importin family members in Klf6-silenced versus NT control primary mouse OLP, and O4+Apc+Mbp- iOL differentiated with T3 for 18 h. Note that Klf6 control of Impα5 expression is selective. (C) Confocal imaging of lumbar spinal cords of E16.5 Olig1Cre:Klf6fl/fl and Klf6fl/fl control embryos (upper panels), and Olig1Cre:Stat3fl/fl and Stat3fl/fl control embryos (lower panels), showing reduced Impα5 expression in oligodendrocyte lineage cells in mice with conditional Klf6 or Stat3 inactivation. Arrowheads in white matter areas (outlined) mark representative cells. Collectively, findings in (A–C) are compatible with the hypothesis that gp130-driven Klf6 uses selective control of Impα5 to regulate oligodendrocyte development (D). (E–G) qPCR, confocal imaging, and immunoblotting data from primary mouse OLP silenced for Impα5, then differentiated with T3 for 24–72 h. In (E), data for the myelin marker Cnp are from 72 h; other data are from 24 h. Note that differentiation markers are strongly reduced in Impα5-silenced cultures at both the RNA (E) and protein levels (F,G). See also S6F Fig. (H) OLP cultures from Klf6fl/flRosa26fl/fl mice were exposed to Ad5CMVCre or Ad5CMV control, then nucleofected with either an Impα5 expression construct or empty vector. Cultures were treated with 40 ng/ml T3 and harvested at 72 h. Notably, recombinant Impα5 significantly increased the proportion of cells expressing the differentiation marker O4. Recombinant Impα5 also partially rescued differentiation in Klf6-deficient cultures. Numbers in panels (G,H) refer to proportion of cells positive for the maturation marker per field at 20x magnification, for at least four fields per condition. Data are mean ± SEM. Statistics, (B,E,G) Student’s t test, (H) ANOVA plus Bonferroni post-test, *p < 0.05, ** p <0.01, *** p <0.001. Scalebars, (C,G,H) 20 μm. Data are representative of at least three independent studies. ChIP-seq data are available on the GEO website (http://www.ncbi.nlm.nih.gov/geo/) (Accession number GSE79245) and in S4 Table. Individual values for all other quantifications are in S1 Data.

