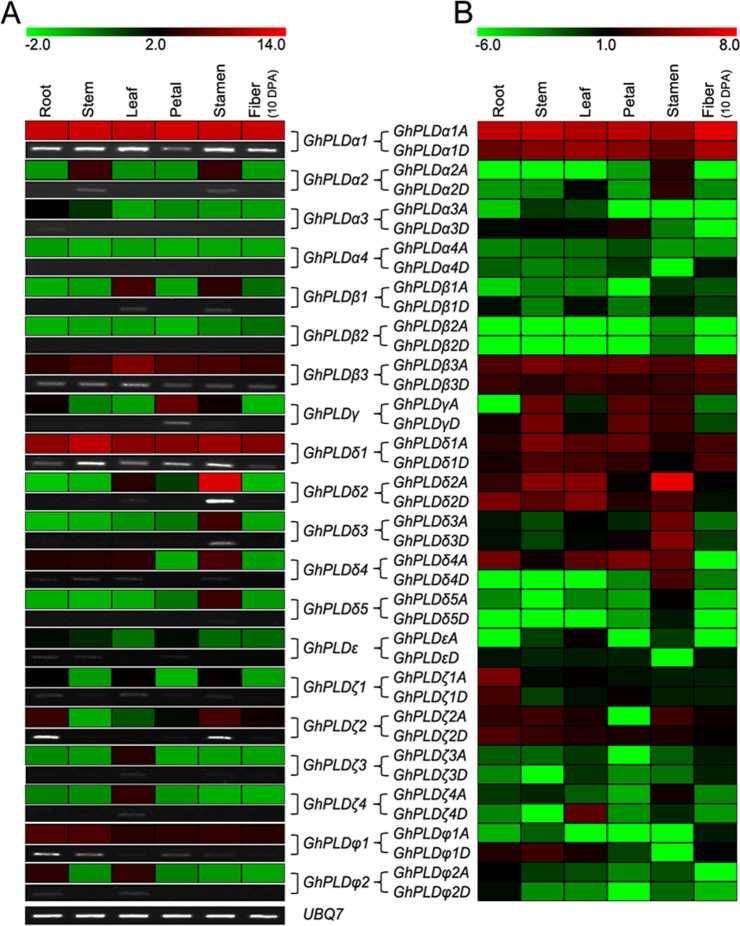
Fig 4. Expression patterns of GhPLDs in different cotton tissues.
Expression patterns of GhPLDs in roots, stems, leaves, petals, stamens, and 10 DPA fibers. A. Real-time quantitative RT-PCR and semi-quantitative PCR results. B. RNA-seq data analysis results. The Illumina reads for expression analysis in cotton roots, stems, leaves, petals, stamens and 10 DPA fibers are retrieved from the NCBI SRA database. The color scale at the top of the left column heat map indicates the relative expression levels where light green indicates low and red indicates high. The color scale at the top of the right column heat map represents the FPKM values normalized log2 transformed counts where light green indicates low and red indicates high.

