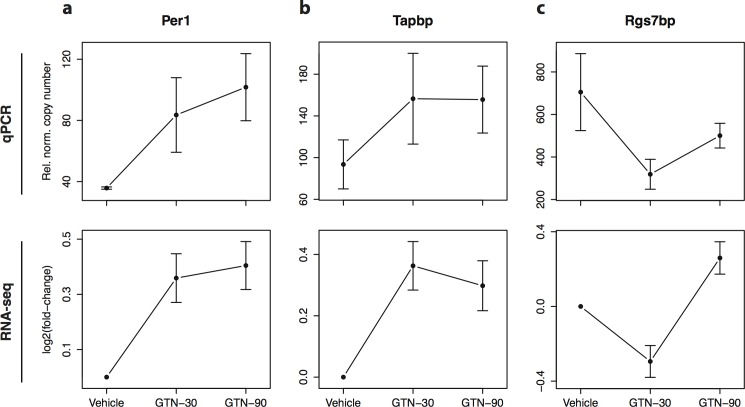
Fig 2. qPCR validation of four differentially expressed genes.
Reverse Transcriptase Semi-quantitative PCR (qPCR) analysis on the set of samples used for RNA-seq analysis for four selected differentially expressed genes (A) RT1-a3 (B) Per1, (C) Tapbp and, (D) Rgs7bp. Upper panels in each subfigure shows the mean and standard error of the relative copy numbers measured by qPCR normalized to Hprt1 (vehicle n = 2, GTN-30 n = 4, and GTN-90 n = 3). Lower panels show the corresponding log-fold changes estimated using RNA-seq as also shown in Fig 1. Plots with normalized RNA-seq counts for all significant genes are provided in S2 Fig.

