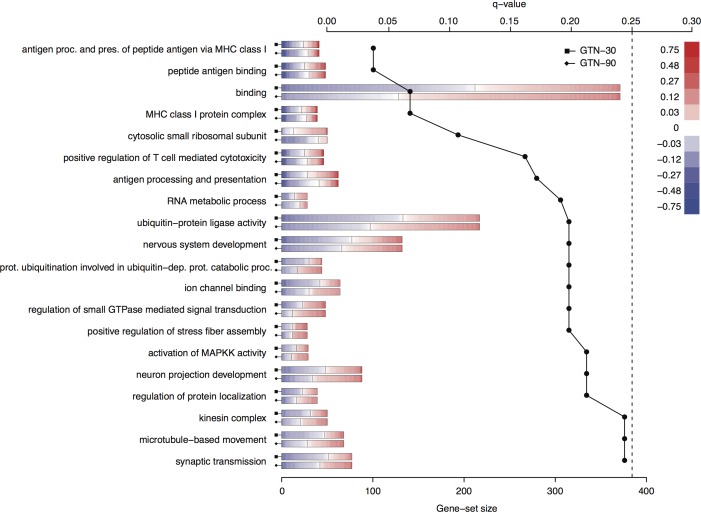
Fig 3. GSANOVA analysis.
Enriched gene-sets in the trigeminal ganglia at two time points (30 and 90 minutes) after GTN infusion as determined by GSANOVA analysis. The solid black line shows the q-value for each gene-set (upper axis); gene-sets with q<0.25 (dotted line) were considered significantly enriched. The horizontal bars show the size of each gene-set (lower axis) with the upper and lower bars for each gene-set representing the 30 and 90 minutes time points, respectively. Within each bar, the gene expression change of every gene in the gene-set is shown as a colored vertical line with genes sorted in increasing order of change (blue and red colors represent down- and up-regulation, respectively). Gene expression values were further square root transformed to render the data more uniformly distributed on the color-scale.

