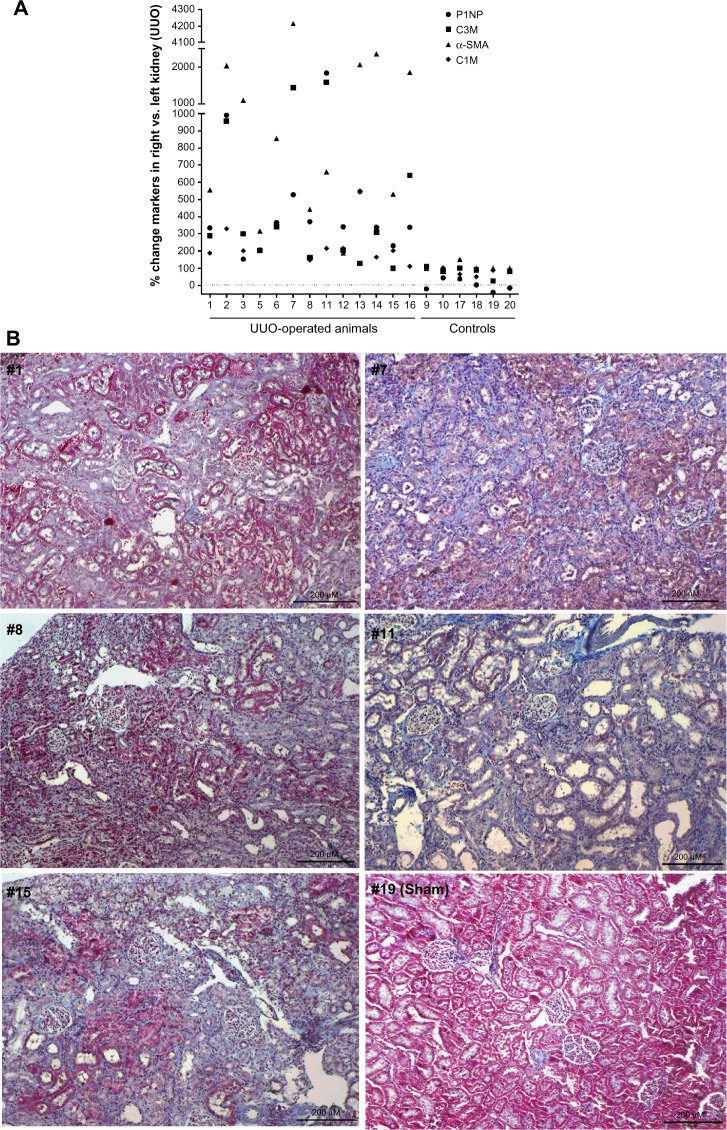
Figure 3.
(A) % level of markers in supernatant of PCKS from the right kidney (the obstructed one in UUO-operated animal) compared with the left kidney in individual animals. (B) Representative sections of right kidneys from five UUO-operated animals (#1, #7, #8, #11, and #15) and a sham-operated animal (#19), stained with Masson’s trichrome staining.

