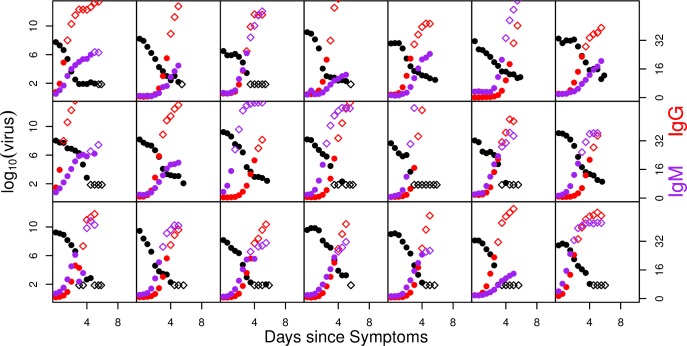
Fig 2. As Fig 1 but for DENV2-infected subjects.
The left hand axis shows log10 viral copies/ml of plasma in black. The right hand axis shows IgG titres in red and IgM titres in purple (both on a linear scale). Each box represents the viral and antibody measurements of a different individual. Unfilled marker symbols show measurements below the assay limit of detection for virus and above the upper limit of reliable (linear) quantification for IgG and IgM [13]. All subjects were classified as secondary infections.

