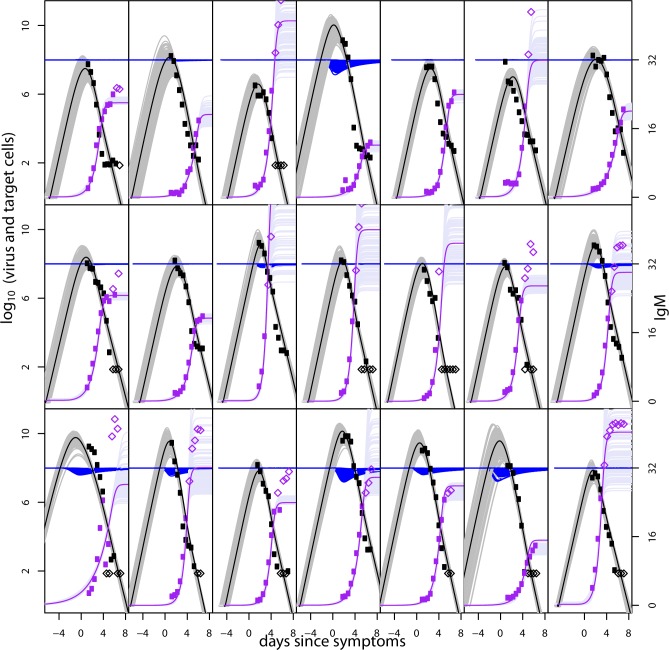
Fig 6. As Fig 5 but for DENV2-infected subjects.
Fit of the model to virus and IgM measurements for DENV1-infected subjects for the ADCC model variant. Each plot shows an individual patient. Virus data is shown in black and IgM data in purple. Parameters z0, η1, η2, IP and SF fitted as patient specific, other parameters fitted per group. Mauve, grey and blue curves show 100 samples from the posterior distributions of antibody, virus and target cell trajectories, respectively. Median fits are shown as bold lines (purple shows IgM, black shows virus). Parameter estimates are shown in Table 3. All subjects were classified as secondary infections.

