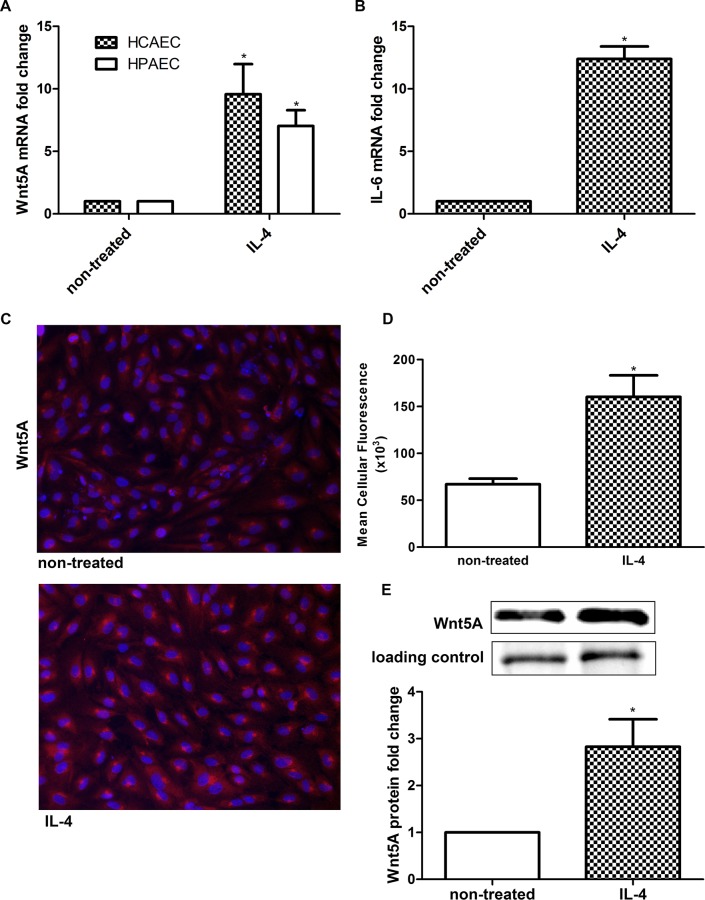
Fig 3. Expression of Wnt5A in IL-4 treated HCAEC.
Fold changes in the expression of (A) Wnt5A mRNA in 8 h IL-4 treated HCAEC and HPAEC and (B) IL-6 mRNA in 8 h IL-4 treated HCAEC. Data were obtained from three independent qRT-PCR experiments run with duplicate samples and expressed as the mean ± SEM. *P<0.05. (C) Wnt5A protein expression in non-treated and IL-4 treated HCAEC. Wnt5A is immunostained (red), nuclei (DAPI, blue). Photomicrographs were acquired using a Zeiss Axioskope equipped with AxioCam MRm digital camera and AxioVision Rel.4.6 software. Original magnification, 200×. (D) Mean cellular fluorescent intensity of Wnt5A. Data represent mean ± SD from five different regions. *P<0.05. The experiment was repeated five times, with analogous results. (E) Immunoblot of Wnt5A induction in IL-4 treated HCAEC. In-gel stained 50 kDa band, served as loading control and for densitometry normalization. Left band, non-treated cells; right band, IL-4 treated cells. Data are mean ± SEM from three independent experiments. *P<0.05.

