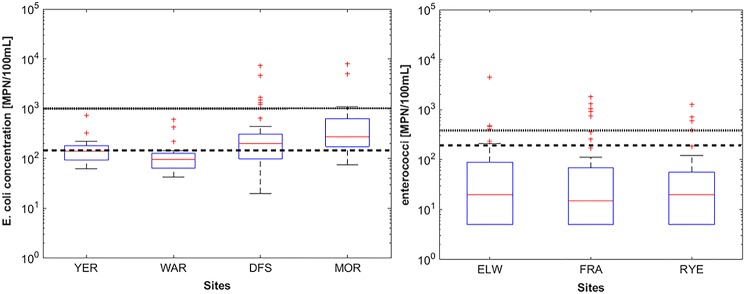
Fig 2. E. coli concentration at the four upstream sites (left) and enterococci concentration recorded at the three beach sites (right).
The dashed and plain lines represents the SEPP thresholds for waters used for primary and secondary contact recreation in the Yarra River, respectively (E. coli = 150 MPN/100 mL and 1000 MPN/100 mL). For the marine water (right) the plain line represents the two thresholds mentioned in the SEPP for Water of Port Phillip Bay that are commonly used for long-term water quality assessment.

