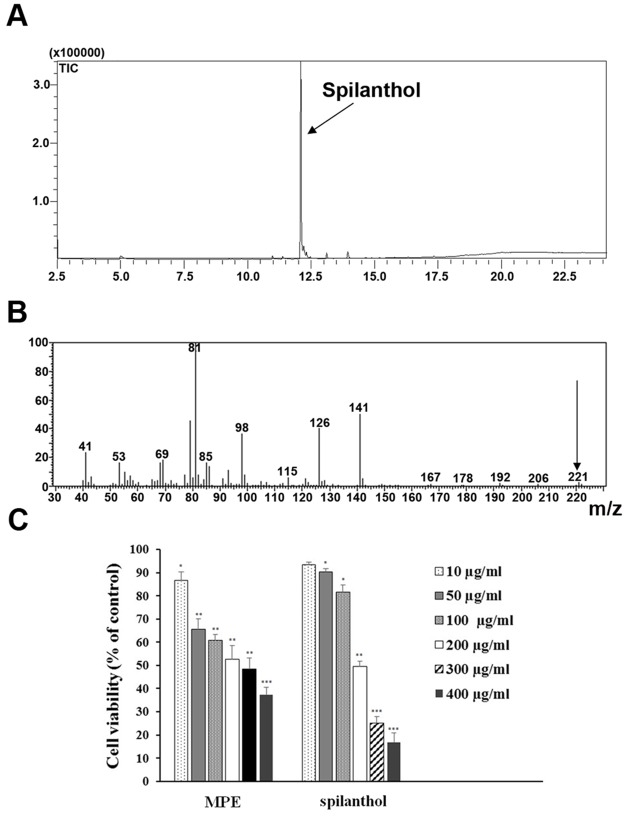
Fig 1. Isolation of spilanthol and evaluation of its cytotoxicity.
(A) Chromatogram of sample containing spilanthol—dichloromethane fractions. (B) Mass spectrum of spilanthol. (C) Viability of HEK293 cells cultured in the absence and presence of diverse doses of either MPE or spilanthol. Cells were subjected to MTT assay as described in Materials and Methods. The cell viability of control cells was defined as 100% (not shown in the histogram). The reported values are mean ± SD from three independent experiments (*p<0.05, **p<0.01, ***p<0.001 vs control).

