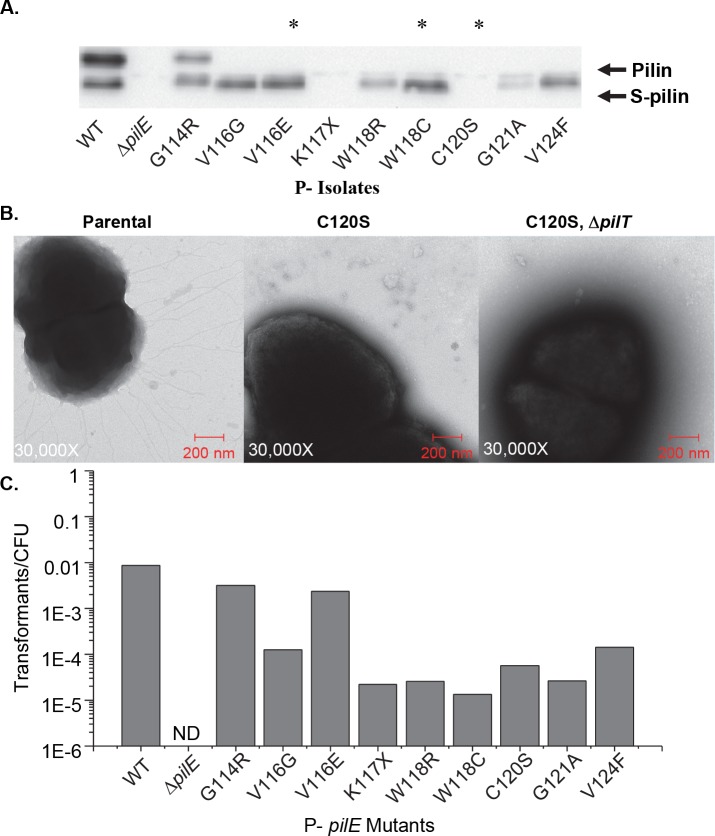
Fig 1. Phenotypic characterization of P- pilE mutants.
A. Representative PilE western blot of whole cell lysates of P- isolates. The upper band is full-length PilE while the lower band is S-pilin. Lanes marked with an * are nonsense or cysteine mutants. Western blot analysis performed using the K36 peptide anti-pilin antibody. B. Representative TEM images of the parental strain (left), a C120S mutant (middle), and a C120S, pilT double mutant (right). C. Transformation efficiencies of representative P- isolates from the screen including nonsense, cysteine mutants, and missense mutants. X = nonsense mutation, ND = transformants not detected.

