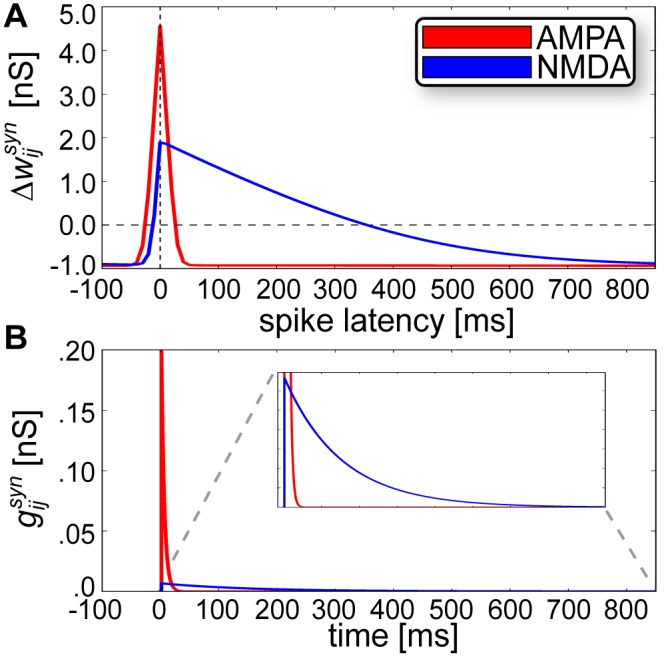
Fig 2. Matching learning and synaptic time constants for AMPA and NMDA.

(A) Absolute change in peak synaptic amplitude after 100 pre- and postsynaptic events at 1 Hz, where spike latency > 0 denotes a pre before post pairing. (B) Postsynaptic conductances elicited by EPSPs via AMPA and NMDA receptors display similar time courses of activation to their corresponding learning window widths from (A). The inset provides a zoomed view of the area contained within the dotted gray lines.
