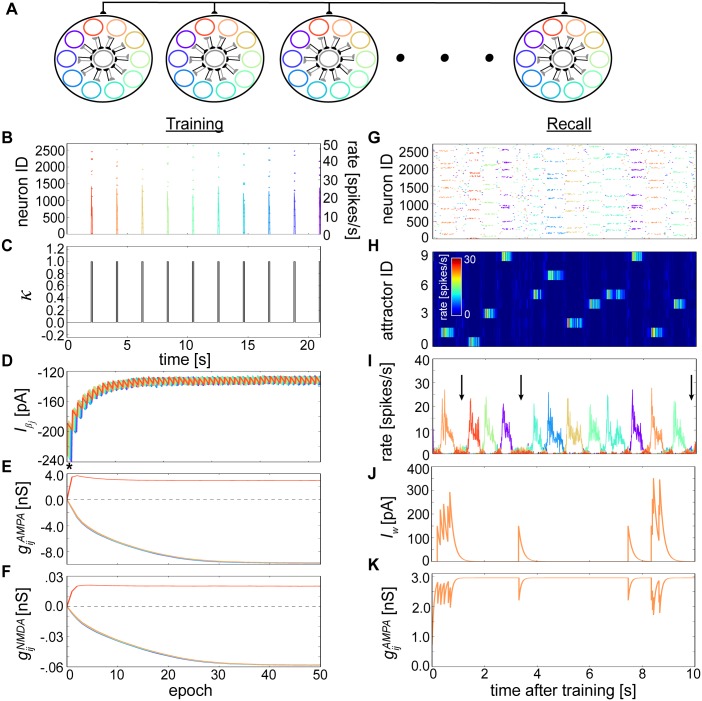
Fig 3. Learning spontaneously wandering attractor states.
(A) Alternate network schematic with hypercolumns (large black circles), along with their member minicolumns (smaller colored circles) and local basket cell populations (centered gray circles). Minicolumns with the same color across different hypercolumns belong to the same pattern; these color indicators are used in the following subfigures. (B) Rastergram (10x downsampled, henceforth) and superimposed firing rates (10 ms bins averaged per pattern, henceforth) associated with the first training epoch. (C) Progression of the ‘print-now’ κ signal whose brief activations are synchronized with the incoming stimuli from (B). (D) Development of during training and averaged over 50 randomly selected neurons per pattern. The period of time shown in (B, C) can be discerned as * for reference. (E) Development of average during training that project from neurons belonging to the first stimulated (i.e. red) pattern, with colors denoting target postsynaptic neuron pattern. (F) Same as (E), except showing development during training. (G) Rastergram snapshot of excitatory neurons during recall. (H) Relative average firing rates based on (G) and sorted by attractor membership. Each row represents the firing rate of one attractor. (I) Average firing rate of the attractors displaying the random progression of the network through state space. Arrows highlight the ground state, which are competitive phases lacking a dominantly active attractor. (J) Evolution of the adaptation current Iw for a single neuron whose activity builds up and attenuates as it enters and exits attractor states. (K) Evolution of the same neuron’s dynamic AMPA strength due to short-term depression, whose postsynaptic target resides within the same attractor.

