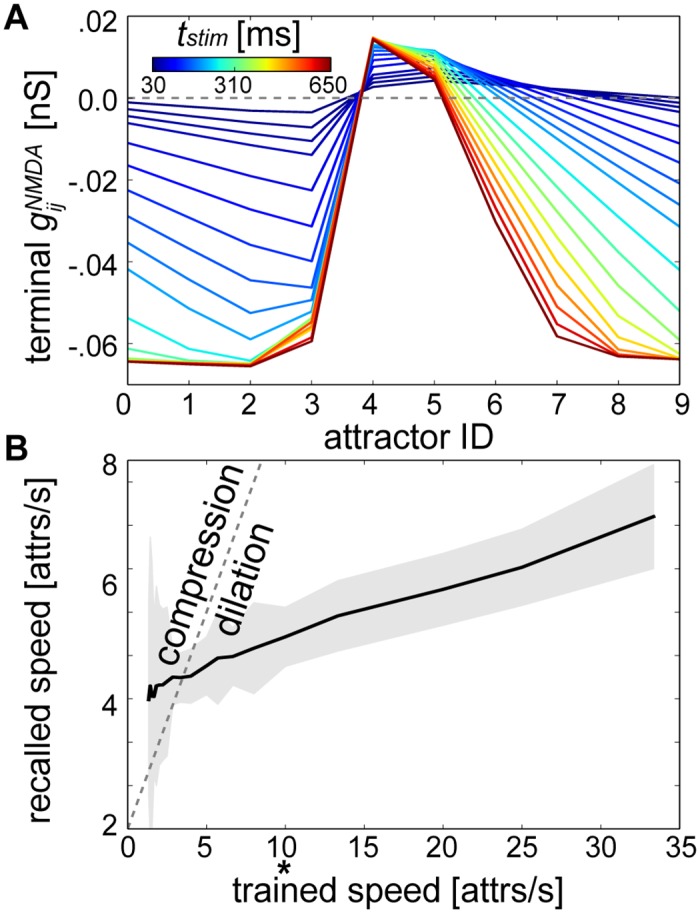
Fig 8. Dependence of temporal sequence speed on the duration of conditioning stimuli.

(A) Average after training as in Fig 4C (reproduced here by the 100 ms line). (B) Speeds computed for the networks from (A) after 1 minute of recall. The dotted gray line represents a linear relationship between training and recall speeds (compression factor = 1), tstim used previously can be discerned as * for reference, “attrs” abbreviates attractors and the shaded areas denotes the standard deviation.
