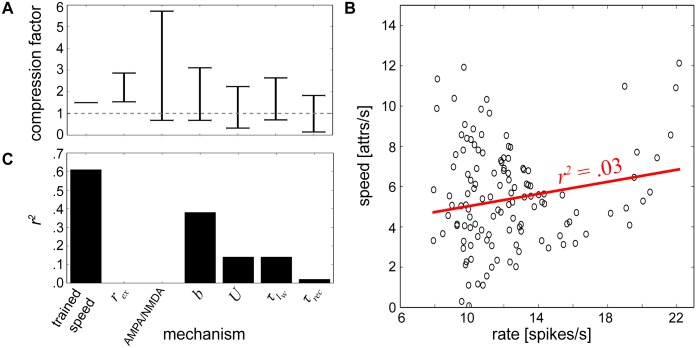
Fig 10. Characterization of speed changes.
(A) Compression factor ranges measured for trained speeds of 2 patterns/second achieved by altering one parameter at a time and keeping all others constant. Horizontal bars denote compression factor cutoffs that were maximally allowable without violating edit distance tolerance levels, and the gray dotted line indicates a compression factor of 1. A second value does not exist for training speed since it was held at 2 patterns/second. (B) Cloud of points summarizing recall speeds and their corresponding firing rates from Fig 9. The linear regression line is displayed in red where r2 represents the square of the Pearson product-moment correlation coefficient of the two variables. (C) Correlation coefficients for individual mechanisms.

