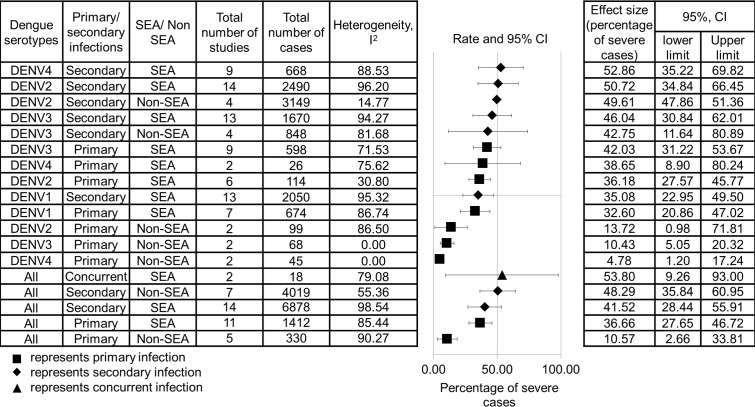
Fig 2. Pooled effect size of the relationship between dengue serotypes and percentage of severe cases.
The data are arranged in a descending order based on the percentage of severe cases of dengue serotypes. The data are separated by primary and secondary infections, as well as SEA and non-SEA regions, regardless of the WHO classification.

