Figure 4.

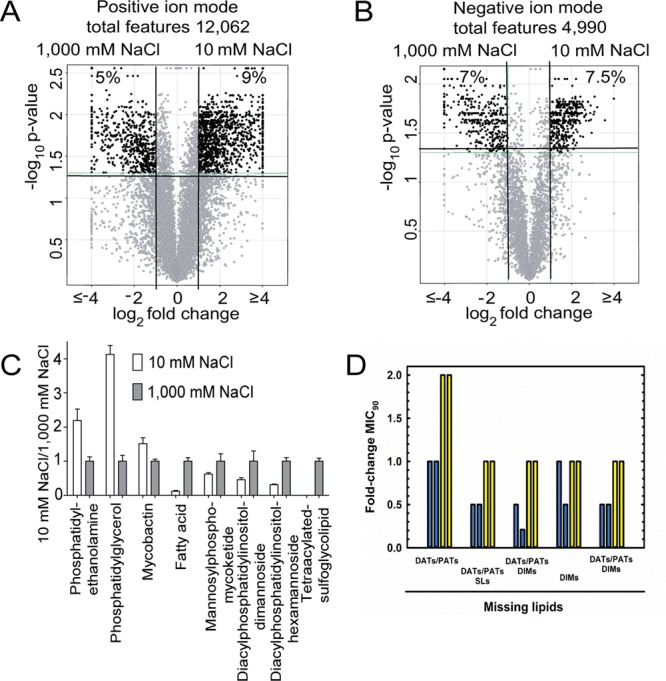
Cell envelope composition is profoundly affected by changes in osmolarity. (A, B) After pairing ions that show equivalent mass and retention time in negative and positive modes, volcano plots illustrate the fold-change in intensity for each paired molecular event. Percent change is calculated as the number of molecular events with intensity fold-change >2 (corrected p < 0.05) divided by the total number of paired events. (C) Selected named lipids of interest were evaluated by comparing their mass and retention times to those of known values in the MycoMass or MycoMap databases and followed by manual reanalysis with ion chromatograms and confirmation of structures by collision induced dissociation mass spectrometry (Figure S5). Data are shown as the mass intensity ratios detected when Mtb is grown at 10 and 1000 mM NaCl. Data are generated from biological triplicate samples and are representative of at least two independent experiments. (D) MIC90 values for GAT against Mtb mutants defective in cell-envelope lipid biosynthesis. Mtb strains were pre-adapted in 10 (blue bars) or 250 (yellow bars) mM NaCl. Each bar indicates data from one independent experiment.
