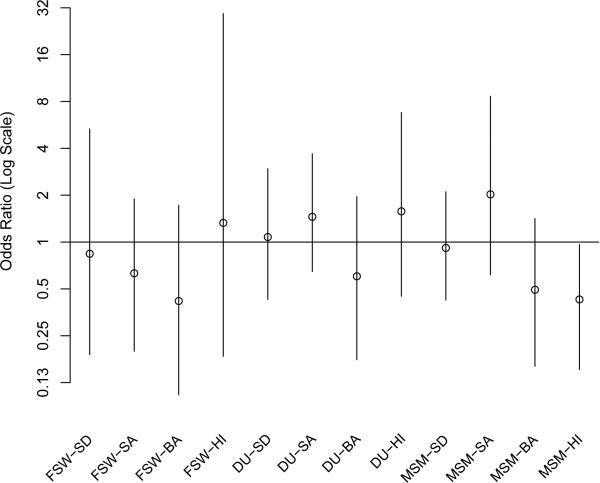
Fig. 11. Motivation-Outcome Plot.
Odds ratios of having HIV given HIV test as motivation for study participation. Ratios greater than 1 indicate those participating for HIV test results more likely to have HIV. For reference, nominal 95% intervals are based on the inversion of Fisher's exact test (these would be confidence intervals if the data were independent identically distributed).

