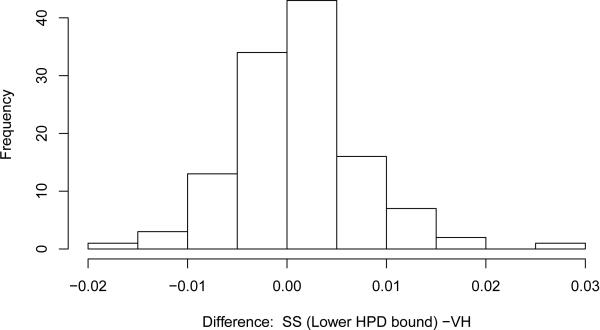
Fig. 4.
Histogram of difference between Successive Sampling and Volz-Heckathorn estimators, over many traits. Successive Sampling estimates based on a “worst case” small approximated population size, based on the lower bound of the Highest Posterior Density interval generated by the population size estimation method in Handcock et al. (2012).

