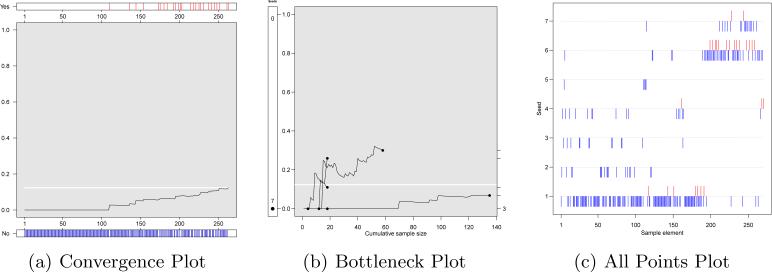
Fig. 7.
Three diagnostic plots for estimates of MSM in Higuey that self-identify as heterosexual. The Convergence Plot (a) shows that data collected late in the sample differs from data collected early in the sample. The Bottleneck Plot (b) shows that the chains explored different subgroups suggesting a problem with bottlenecks. The All Points Plots (c) shows that the self-identified heterosexuals (represented by up-ticks in the plot) were unusual in that they both arrived in the sample late and arrived from a small number of chains, a fact that is difficult to infer from the previous two plots.

