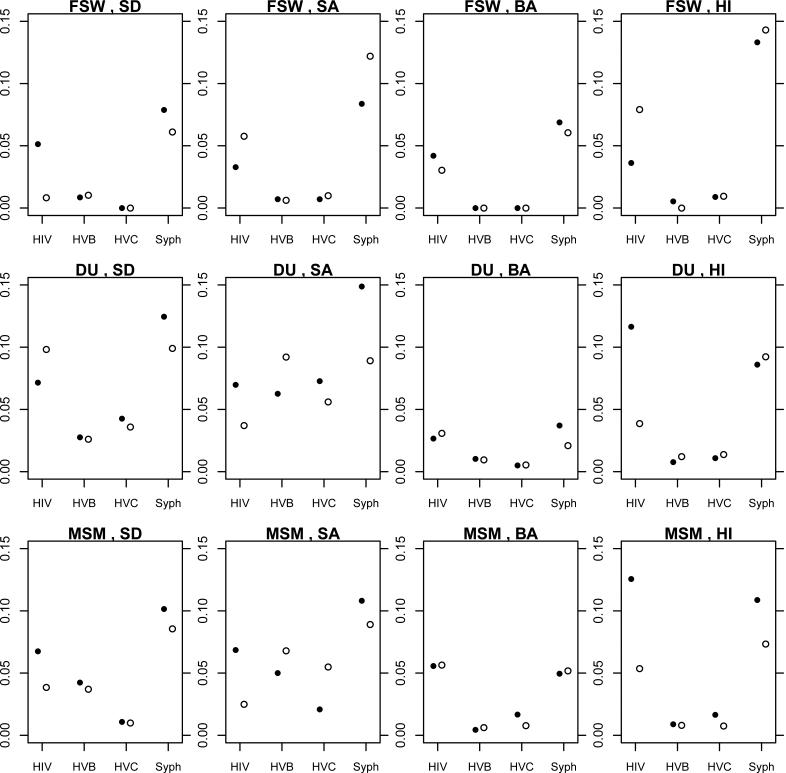
Fig. 8.
Disease prevalence estimates from 12 studies for 4 diseases using Question G at enrollment (solid circle) and follow-up (hollow circle). The plot includes only people who participated in both the initial and follow-up survey (see Fig. 2 for sample sizes).

