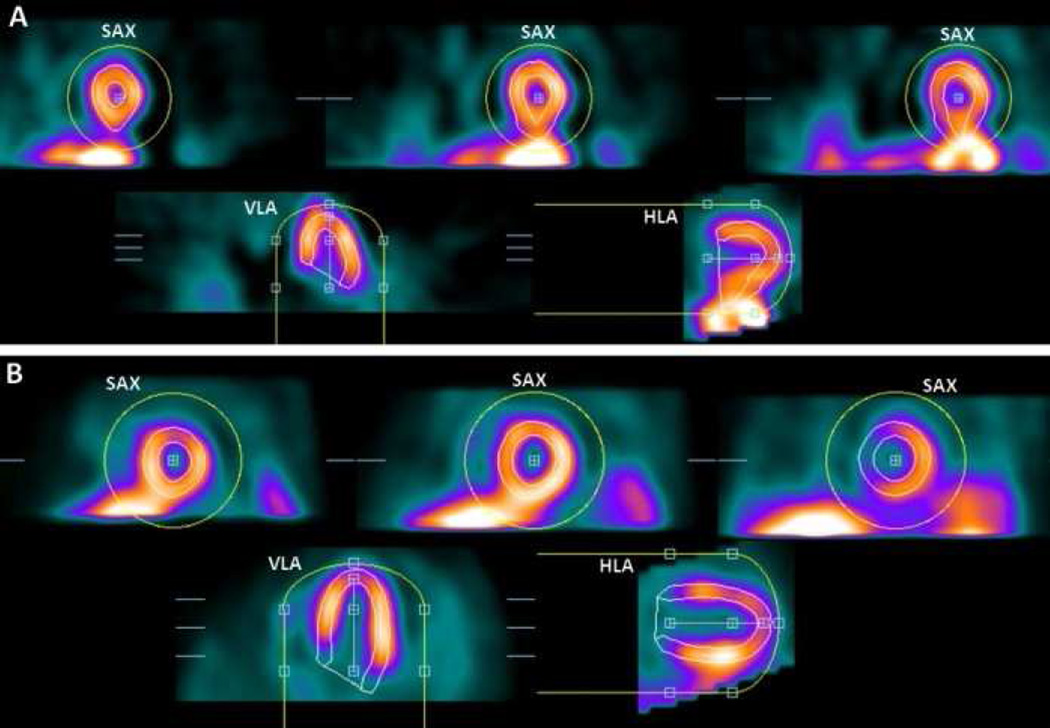
Figure 1. LV segmentation errors.
In each image, top images are in short-axis orientation (SAX), and bottom images are in horizontal- and vertical (long)-axis orientation (HLA, VLA). Yellow circles show initial masks, and LV contours are shown in white. Panel (A) shows an example of mask-failure due to extracardiac activity. Panel (B) shows an example of valve-plane overshooting.
Adapted from Xu Y, Kavanagh P, Fish M, et al. Automated Quality Control for Segmentation of Myocardial Perfusion SPECT. J Nucl Med 2009;50:1418–26; with permission.

