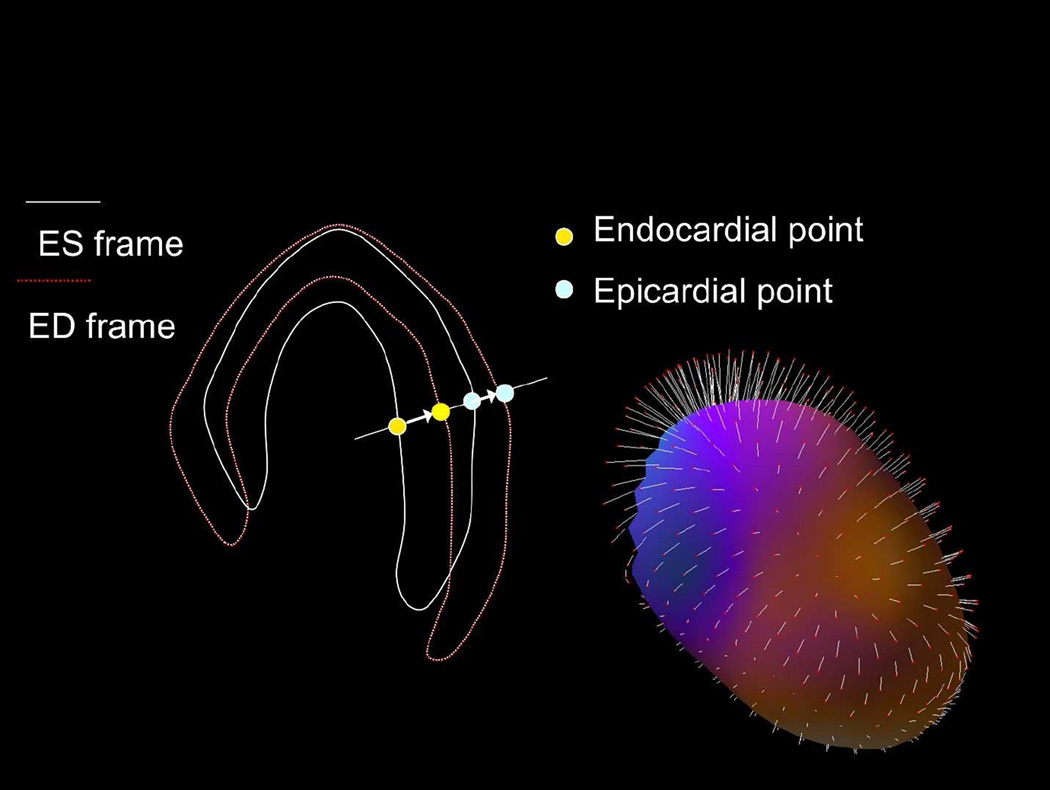
Figure 6. The principle of motion-frozen technique.
Three-dimensional (3D) left ventricular (LV) contours are identified on images from different cardiac phases. End-systolic (ES – white) and end-diastolic (ED –red) frames are shown on the left. 3D phase to phase motion vectors are derived by sampling epi- and endocardial surfaces. 3D motion vectors are shown on the right, superimposed on epicardial surface of the LV ventricle. A non-linear image warping is than applied to warp all image phases to fit the ED phase.
Adapted from Slomka PJ, Nishina H, Berman DS, et al. “Motion-frozen” display and quantification of myocardial perfusion. J Nucl Med 2004;45:1128–34; with permission.

