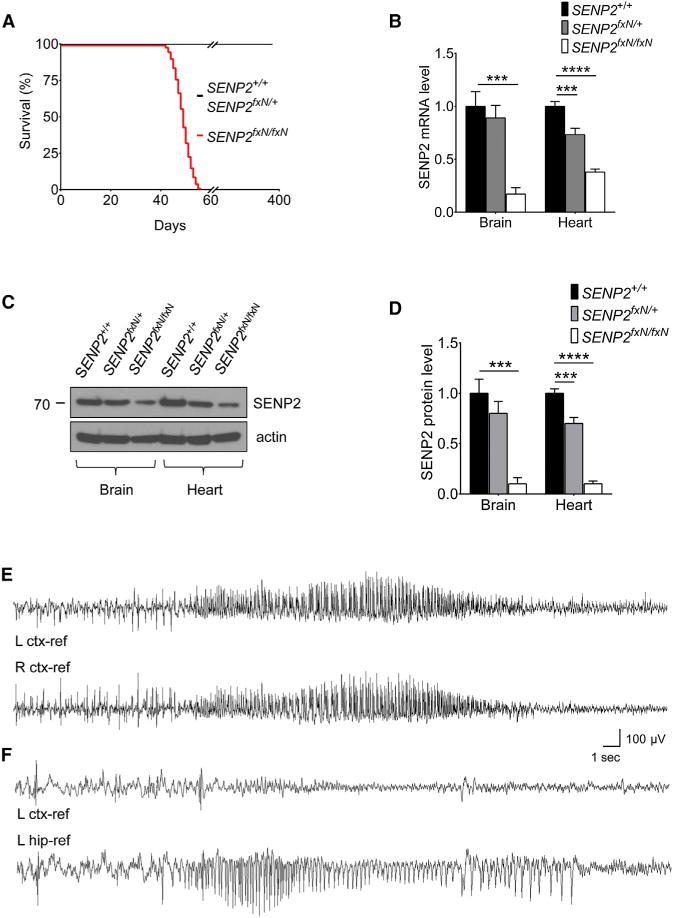
Figure 1. SENP2 Deficiency Causes Seizures and Sudden Death.

(A) Lifespan of SENP2+/+ (n = 120), SENP2fxN/+ (n = 108), and SENP2fxN/fxN (n = 110) mice.
(B) Expression level of SENP2 transcripts in brain and heart of SENP2+/+, SENP2fxN/+ and SENP2fxN/fxN mice. SENP2 transcript level was measured by real-time PCR, normalized to SENP2+/+ control (n = 3 mice/group). The ANOVA revealed a significant differences between the groups from brain (F[2,6] = 48.94, p < 0.001) and heart (F[2,6] = 137.1, p < 0.0001).
(C) Western blot analysis of brain and heart extracts of SENP2+/+, SENP2fxN/+, and SENP2fxN/fxN mice with anit-SENP2 and anti-actin antibodies.
(D) The ratios of SENP2 protein to actin of SENP2+/+, SENP2fxN/+, and SENP2fxN/fxN mice were normalized to SENP2+/+ mice (n = 3 mice/group). The ANOVA revealed a significant differences between the groups from brain (F[2,6] = 53.9, p < 0.001) and heart (F[2,6] = 296.8, p < 0.0001).
(E) Representative EEG seizures recorded from awake SENP2fxN/fxN mice at 7 weeks of age (n = 3). EEG traces revealed baseline low-amplitude desynchronized activity with frequent sharp interictal spikes followed by onset of spontaneous non-convulsive bilateral seizure.
(F) Representative traces recorded simultaneously from the left cortex (upper) and the left hippocampus (lower) of SENP2fxN/fxN mice (n = 3). EEG traces showed isolated electrographic hippocampal seizure; overlying cortex displays only a decremental activity EEG pattern.
Values are shown as mean ± SEM. ***p < 0.001; ****p < 0.0001 by one-way ANOVA followed by Dunnett’s test. See also Figures S1–S3 and Movies S1, S2, and S3.
