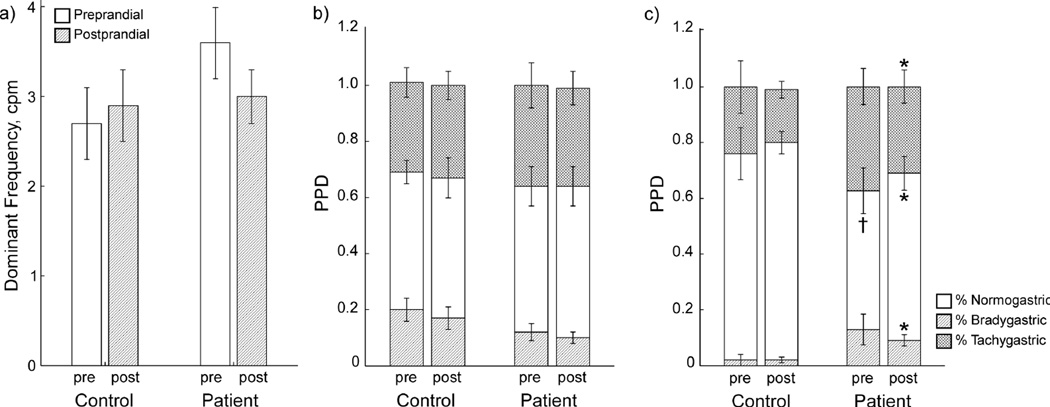
Figure 4.
Frequency analyses from EGG/MGG. (a) Slow wave dominant frequencies determined from MGG and EGG. Gastroparesis patients tend toward higher slow wave frequencies than normal controls, but the difference was not significant. Percent Power Distribution from EGG (b) show no significant differences, but MGG PPDs (c) showed significantly lower normal slow waves and significantly higher brady- and tachygastria in gastroparesis patients compared to normal controls. * indicates significant difference vs. control values (p < 0.05). † indicates borderline significant difference vs. control (p = 0.06).

